Predict Wine quality with data analytics (Part 2)
February 9, 2020
Part II of Predict Wine quality with data analytics .
Objective
I finished 2019 with a nice project for a client in the wine industry. I wanted materials linked to wine to popularize how Data and Analytics could help business gain more value.
In the perspective of how we could use analytics for his business, I point up a case widely known in the data science community using analytics to predict wine quality. The case is about predicting the quality of the Vinho Verde wine based on various psychochemical tests only.
Vinho Verde is exclusively produced in the demarcated region of Vinho Verde in northwestern Portugal, it is only produced from the indigenous grape varieties of the region, preserving its typicity of aromas and flavors. From there we will plan Data strategy based on Company data for business perspectives: Real time (Sales Dashboarding, KPI, ROI), Next best buy, upsell, Customer experience, campaign, …
This report is a quick and dirty analysis to prepare a presentation.
Models
In this work, machine learning techniques are used to determine dependency of wine quality on other variables and in wine quality predictions. This section suumarise all insights of proposed methodology.
1 - Linear Model
2 - Ordinal logistic Regression
3 - Logistic Regression
4 - Random forest,Boosting Algorithms and Bagging Algorithms.
5 - Ensemble models
Linear Model
Linear regression is an analysis that assesses whether one or more predictor variables explain the dependent (criterion) variable.
This is not always the best model, but it’s okay to start with, so that we have a basic sense of the relationship between the independent variable and dependent variable. The R2 values of our models are not good.
The regression has five key assumptions:
Assumption for linear model
Linear relationship, No or little multicollinearity, Multivariate normality, No auto-correlation, Homoscedasticity.
Let’s before create our model split the data on Train-Test Set.
Train-Test split is a practice that is followed in the model building and evaluation workflow. Testing your dataset on a testing data that is totally excluded from the training data helps us find whether the model is overfitting or underfitting atleast.
Separating the data enables to evaluate the model generalization capabilities and have an idea of how it would perform on unseen data.
library("rmdformats")
library("corrgram")
library("MASS")
library("ggplot2")
library("naniar")
library("e1071")
library("lattice")
Step 1 : Are all the hypothesis met for a linear model?
set.seed(100)
trainingRowIndex <- sample(1:nrow(new_wine_white), 0.8*nrow(new_wine_white))
wine_whitetrain <- new_wine_white[trainingRowIndex, ]
wine_whitetest  <- new_wine_white[-trainingRowIndex, ]
Let’s see if all the hypothesis are met for a linear model.
Do all the variables entered in the model?
linear_for_multicoli_1 <- lm(trans.quality ~ . , wine_whitetrain) # taking all the points.
summary(linear_for_multicoli_1)
##
## Call:
## lm(formula = trans.quality ~ ., data = wine_whitetrain)
##
## Residuals:
## Min 1Q Median 3Q Max
## -3.8534 -0.4741 -0.0268 0.4817 3.0811
##
## Coefficients:
## Estimate Std. Error t value Pr(>|t|)
## (Intercept) 5.85934 0.01376 425.935 < 2e-16 ***
## trans.fixed.acidity 0.06469 0.02129 3.039 0.00240 **
## trans.volatile.acidity -0.16719 0.01526 -10.959 < 2e-16 ***
## trans.citric.acid 0.05436 0.01736 3.132 0.00176 **
## trans.residual.sugar 0.33715 0.03358 10.040 < 2e-16 ***
## trans.chlorides -0.05839 0.01907 -3.062 0.00222 **
## trans.free.sulfur.dioxide 0.13644 0.01901 7.179 8.84e-13 ***
## trans.total.sulfur.dioxide -0.04399 0.02148 -2.048 0.04066 *
## trans.density -0.43953 0.05738 -7.660 2.49e-14 ***
## trans.pH 0.12730 0.01875 6.788 1.37e-11 ***
## trans.sulphates 0.07755 0.01477 5.252 1.61e-07 ***
## trans.alcohol 0.18185 0.03587 5.069 4.24e-07 ***
## ---
## Signif. codes: 0 '***' 0.001 '**' 0.01 '*' 0.05 '.' 0.1 ' ' 1
##
## Residual standard error: 0.75 on 2988 degrees of freedom
## Multiple R-squared: 0.3037, Adjusted R-squared: 0.3012
## F-statistic: 118.5 on 11 and 2988 DF, p-value: < 2.2e-16multicollinearity?
In multiple regression, two or more predictor variables might be correlated with each other. This situation is referred as collinearity. This means that there is redundancy between predictor variables. In the presence of multicollinearity, the solution of the regression model becomes unstable. For a given predictor (p), multicollinearity can assessed by computing a score called the variance inflation factor (or VIF), which measures how much the variance of a regression coefficient is inflated due to multicollinearity in the model.
The smallest possible value of VIF is one (absence of multicollinearity). As a rule of thumb, a VIF value that exceeds 5 or 10 indicates a problematic amount of collinearity 2. When faced to multicollinearity, the concerned variables should be removed, since the presence of multicollinearity implies that the information that this variable provides about the response is redundant in the presence of the other variables 3. In the presence of multicollinearity, the solution of the regression model becomes unstable.
Let’s plot acorrelation plot as previously and compute the VIF.
library("corrgram")
plot_correlation(wine_whitetrain, cor_args = list( 'use' = 'complete.obs'))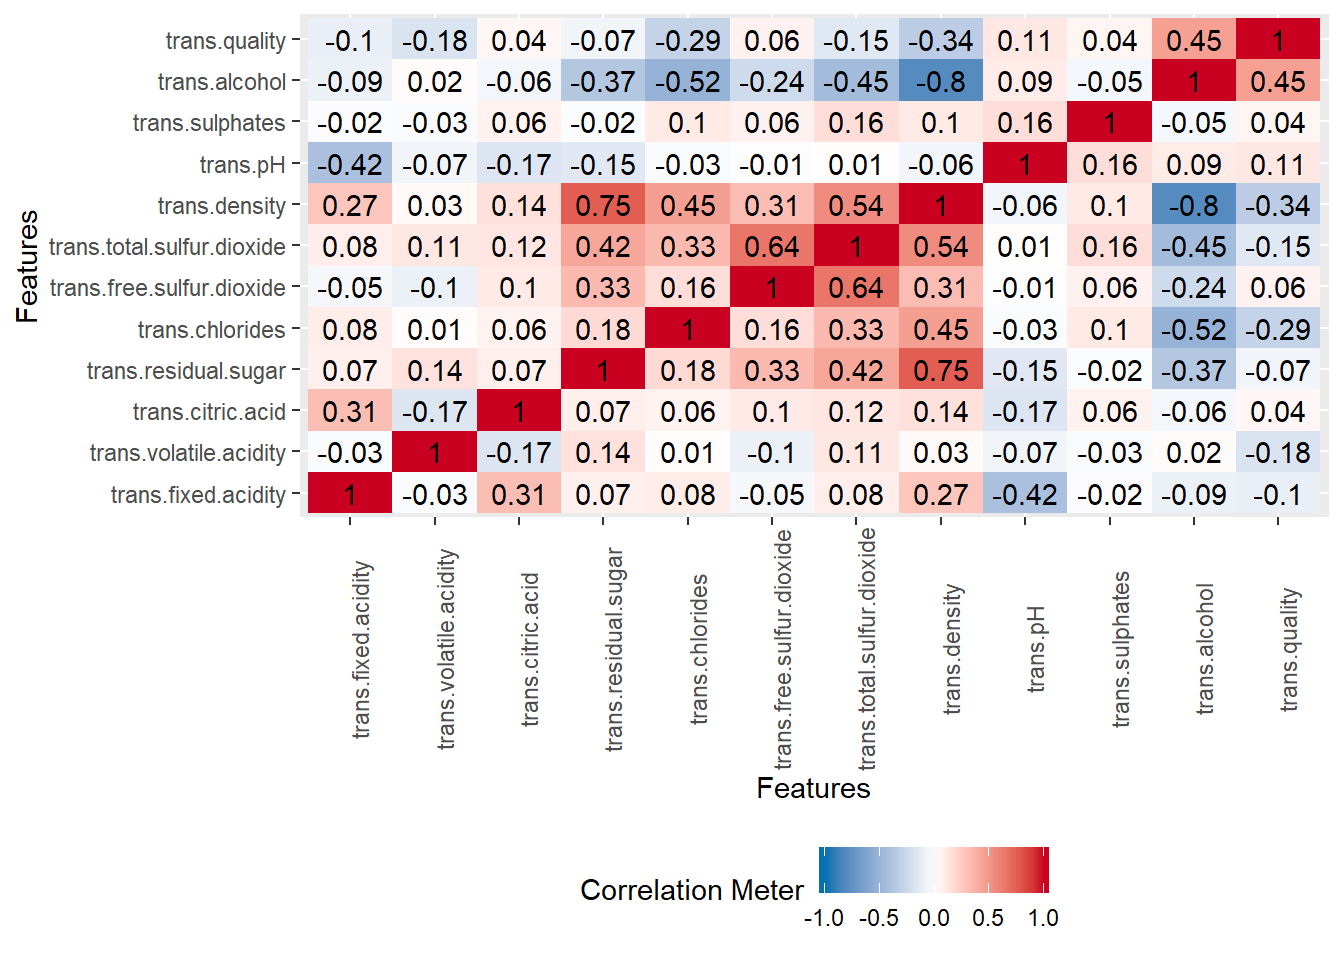
car::vif(linear_for_multicoli_1)## trans.fixed.acidity trans.volatile.acidity
## 2.263793 1.165369
## trans.citric.acid trans.residual.sugar
## 1.173586 5.978815
## trans.chlorides trans.free.sulfur.dioxide
## 1.434429 1.922794
## trans.total.sulfur.dioxide trans.density
## 2.427215 16.330205
## trans.pH trans.sulphates
## 1.732787 1.110997
## trans.alcohol
## 6.804558We can see multicollinarity over here. the VIF score for the predictor variable trans.density is very high (VIF = 16.33). This might be problematic.We remove trans.density because it exibits multicollinarity. Now let’s restart fitting the new model by withdrawing trans.density and recompute VIF.
linear_for_multicoli_2 <- lm(trans.quality ~ . -trans.density , wine_whitetrain)
 summary(linear_for_multicoli_2)
##
## Call:
## lm(formula = trans.quality ~ . - trans.density, data = wine_whitetrain)
##
## Residuals:
## Min 1Q Median 3Q Max
## -3.7902 -0.4782 -0.0268 0.4760 3.0761
##
## Coefficients:
## Estimate Std. Error t value Pr(>|t|)
## (Intercept) 5.86326 0.01388 422.458 < 2e-16 ***
## trans.fixed.acidity -0.03843 0.01665 -2.308 0.021067 *
## trans.volatile.acidity -0.16051 0.01538 -10.438 < 2e-16 ***
## trans.citric.acid 0.04665 0.01749 2.667 0.007704 **
## trans.residual.sugar 0.11115 0.01620 6.863 8.16e-12 ***
## trans.chlorides -0.07692 0.01910 -4.027 5.78e-05 ***
## trans.free.sulfur.dioxide 0.14609 0.01915 7.630 3.13e-14 ***
## trans.total.sulfur.dioxide -0.06090 0.02157 -2.823 0.004787 **
## trans.pH 0.05653 0.01648 3.431 0.000610 ***
## trans.sulphates 0.05557 0.01462 3.800 0.000147 ***
## trans.alcohol 0.42001 0.01807 23.240 < 2e-16 ***
## ---
## Signif. codes: 0 '***' 0.001 '**' 0.01 '*' 0.05 '.' 0.1 ' ' 1
##
## Residual standard error: 0.7572 on 2989 degrees of freedom
## Multiple R-squared: 0.2901, Adjusted R-squared: 0.2877
## F-statistic: 122.1 on 10 and 2989 DF, p-value: < 2.2e-16linear_for_multicoli_2 <- lm(trans.quality ~ . -trans.density , wine_whitetrain)
summary(linear_for_multicoli_2)##
## Call:
## lm(formula = trans.quality ~ . - trans.density, data = wine_whitetrain)
##
## Residuals:
## Min 1Q Median 3Q Max
## -3.7902 -0.4782 -0.0268 0.4760 3.0761
##
## Coefficients:
## Estimate Std. Error t value Pr(>|t|)
## (Intercept) 5.86326 0.01388 422.458 < 2e-16 ***
## trans.fixed.acidity -0.03843 0.01665 -2.308 0.021067 *
## trans.volatile.acidity -0.16051 0.01538 -10.438 < 2e-16 ***
## trans.citric.acid 0.04665 0.01749 2.667 0.007704 **
## trans.residual.sugar 0.11115 0.01620 6.863 8.16e-12 ***
## trans.chlorides -0.07692 0.01910 -4.027 5.78e-05 ***
## trans.free.sulfur.dioxide 0.14609 0.01915 7.630 3.13e-14 ***
## trans.total.sulfur.dioxide -0.06090 0.02157 -2.823 0.004787 **
## trans.pH 0.05653 0.01648 3.431 0.000610 ***
## trans.sulphates 0.05557 0.01462 3.800 0.000147 ***
## trans.alcohol 0.42001 0.01807 23.240 < 2e-16 ***
## ---
## Signif. codes: 0 '***' 0.001 '**' 0.01 '*' 0.05 '.' 0.1 ' ' 1
##
## Residual standard error: 0.7572 on 2989 degrees of freedom
## Multiple R-squared: 0.2901, Adjusted R-squared: 0.2877
## F-statistic: 122.1 on 10 and 2989 DF, p-value: < 2.2e-16#Make predictions
predictions <- linear_for_multicoli_2 %>% predict(wine_whitetest)
#Model performance"
model_performence_vif1<-data.frame(
RMSE = RMSE(predictions, wine_whitetest$trans.quality),
R2 = R2(predictions, wine_whitetest$trans.quality)
)
table(model_performence_vif1)## R2
## RMSE 0.289487656369341
## 0.707058318559868 1the variable trans.fixed.acidity is not significant ON the same level of the other variables, let’s withdraw it and We fit another model.
linear_for_multicoli_3 <- lm(trans.quality ~ . -trans.density - trans.fixed.acidity, wine_whitetrain)
summary(linear_for_multicoli_3)
##
## Call:
## lm(formula = trans.quality ~ . - trans.density - trans.fixed.acidity,
## data = wine_whitetrain)
##
## Residuals:
## Min 1Q Median 3Q Max
## -3.8071 -0.4730 -0.0288 0.4864 2.9932
##
## Coefficients:
## Estimate Std. Error t value Pr(>|t|)
## (Intercept) 5.86262 0.01389 422.191 < 2e-16 ***
## trans.volatile.acidity -0.15813 0.01535 -10.299 < 2e-16 ***
## trans.citric.acid 0.03683 0.01698 2.169 0.030187 *
## trans.residual.sugar 0.11157 0.01621 6.884 7.06e-12 ***
## trans.chlorides -0.07843 0.01910 -4.106 4.13e-05 ***
## trans.free.sulfur.dioxide 0.15380 0.01887 8.152 5.19e-16 ***
## trans.total.sulfur.dioxide -0.06803 0.02136 -3.184 0.001466 **
## trans.pH 0.07169 0.01512 4.741 2.23e-06 ***
## trans.sulphates 0.05528 0.01463 3.778 0.000161 ***
## trans.alcohol 0.41982 0.01809 23.213 < 2e-16 ***
## ---
## Signif. codes: 0 '***' 0.001 '**' 0.01 '*' 0.05 '.' 0.1 ' ' 1
##
## Residual standard error: 0.7577 on 2990 degrees of freedom
## Multiple R-squared: 0.2888, Adjusted R-squared: 0.2867
## F-statistic: 134.9 on 9 and 2990 DF, p-value: < 2.2e-16same comment for trans.citric.acid. We refit another model removing trans.citric.acid.
linear_for_multicoli_4 <- lm(trans.quality ~ . -trans.density - trans.fixed.acidity - trans.citric.acid, wine_whitetrain)
summary(linear_for_multicoli_4)
##
## Call:
## lm(formula = trans.quality ~ . - trans.density - trans.fixed.acidity -
## trans.citric.acid, data = wine_whitetrain)
##
## Residuals:
## Min 1Q Median 3Q Max
## -3.8418 -0.4752 -0.0350 0.4873 3.0320
##
## Coefficients:
## Estimate Std. Error t value Pr(>|t|)
## (Intercept) 5.86025 0.01385 423.066 < 2e-16 ***
## trans.volatile.acidity -0.16495 0.01504 -10.969 < 2e-16 ***
## trans.residual.sugar 0.11271 0.01621 6.954 4.34e-12 ***
## trans.chlorides -0.07753 0.01911 -4.057 5.10e-05 ***
## trans.free.sulfur.dioxide 0.15277 0.01887 8.095 8.22e-16 ***
## trans.total.sulfur.dioxide -0.06309 0.02126 -2.968 0.00302 **
## trans.pH 0.06515 0.01483 4.394 1.15e-05 ***
## trans.sulphates 0.05743 0.01461 3.931 8.65e-05 ***
## trans.alcohol 0.42159 0.01808 23.321 < 2e-16 ***
## ---
## Signif. codes: 0 '***' 0.001 '**' 0.01 '*' 0.05 '.' 0.1 ' ' 1
##
## Residual standard error: 0.7582 on 2991 degrees of freedom
## Multiple R-squared: 0.2877, Adjusted R-squared: 0.2858
## F-statistic: 151 on 8 and 2991 DF, p-value: < 2.2e-16car::vif(linear_for_multicoli_4)## trans.volatile.acidity trans.residual.sugar
## 1.107818 1.362757
## trans.chlorides trans.free.sulfur.dioxide
## 1.409025 1.854808
## trans.total.sulfur.dioxide trans.pH
## 2.325575 1.059890
## trans.sulphates trans.alcohol
## 1.064101 1.690718At this step results seems good to go.
What about the Homoscedasticity?
Analysis of variance (ANOVA) generalizes the t-test to more than two groups. It is useful for comparing (testing) three or more group means for statistical significance.
anova(linear_for_multicoli_4)## Analysis of Variance Table
##
## Response: trans.quality
## Df Sum Sq Mean Sq F value Pr(>F)
## trans.volatile.acidity 1 81.85 81.851 142.3808 < 2.2e-16 ***
## trans.residual.sugar 1 5.50 5.495 9.5592 0.002008 **
## trans.chlorides 1 194.22 194.219 337.8440 < 2.2e-16 ***
## trans.free.sulfur.dioxide 1 22.41 22.413 38.9880 4.868e-10 ***
## trans.total.sulfur.dioxide 1 40.15 40.147 69.8364 < 2.2e-16 ***
## trans.pH 1 25.99 25.993 45.2157 2.106e-11 ***
## trans.sulphates 1 11.70 11.697 20.3478 6.705e-06 ***
## trans.alcohol 1 312.65 312.646 543.8491 < 2.2e-16 ***
## Residuals 2991 1719.46 0.575
## ---
## Signif. codes: 0 '***' 0.001 '**' 0.01 '*' 0.05 '.' 0.1 ' ' 1par(mfrow=c(2,2), oma = c(1,1,0,0) + 0.1, mar = c(3,3,1,1) + 0.1)
plot(linear_for_multicoli_4)
The F- Statistic - p value <= 2.2e -16.
We can see that p value is less than 0.05. Thus we can reject the null hypothesis and accept the alternate hypothesis. Thus,we can say that the model is significant.
The Retain model
steplinear <- step(linear_for_multicoli_4)## Start: AIC=-1651.81
## trans.quality ~ (trans.fixed.acidity + trans.volatile.acidity +
## trans.citric.acid + trans.residual.sugar + trans.chlorides +
## trans.free.sulfur.dioxide + trans.total.sulfur.dioxide +
## trans.density + trans.pH + trans.sulphates + trans.alcohol) -
## trans.density - trans.fixed.acidity - trans.citric.acid
##
## Df Sum of Sq RSS AIC
## <none> 1719.5 -1651.8
## - trans.total.sulfur.dioxide 1 5.065 1724.5 -1645.0
## - trans.sulphates 1 8.883 1728.3 -1638.3
## - trans.chlorides 1 9.463 1728.9 -1637.3
## - trans.pH 1 11.098 1730.5 -1634.5
## - trans.residual.sugar 1 27.800 1747.3 -1605.7
## - trans.free.sulfur.dioxide 1 37.675 1757.1 -1588.8
## - trans.volatile.acidity 1 69.171 1788.6 -1535.5
## - trans.alcohol 1 312.646 2032.1 -1152.6summary(steplinear)##
## Call:
## lm(formula = trans.quality ~ (trans.fixed.acidity + trans.volatile.acidity +
## trans.citric.acid + trans.residual.sugar + trans.chlorides +
## trans.free.sulfur.dioxide + trans.total.sulfur.dioxide +
## trans.density + trans.pH + trans.sulphates + trans.alcohol) -
## trans.density - trans.fixed.acidity - trans.citric.acid,
## data = wine_whitetrain)
##
## Residuals:
## Min 1Q Median 3Q Max
## -3.8418 -0.4752 -0.0350 0.4873 3.0320
##
## Coefficients:
## Estimate Std. Error t value Pr(>|t|)
## (Intercept) 5.86025 0.01385 423.066 < 2e-16 ***
## trans.volatile.acidity -0.16495 0.01504 -10.969 < 2e-16 ***
## trans.residual.sugar 0.11271 0.01621 6.954 4.34e-12 ***
## trans.chlorides -0.07753 0.01911 -4.057 5.10e-05 ***
## trans.free.sulfur.dioxide 0.15277 0.01887 8.095 8.22e-16 ***
## trans.total.sulfur.dioxide -0.06309 0.02126 -2.968 0.00302 **
## trans.pH 0.06515 0.01483 4.394 1.15e-05 ***
## trans.sulphates 0.05743 0.01461 3.931 8.65e-05 ***
## trans.alcohol 0.42159 0.01808 23.321 < 2e-16 ***
## ---
## Signif. codes: 0 '***' 0.001 '**' 0.01 '*' 0.05 '.' 0.1 ' ' 1
##
## Residual standard error: 0.7582 on 2991 degrees of freedom
## Multiple R-squared: 0.2877, Adjusted R-squared: 0.2858
## F-statistic: 151 on 8 and 2991 DF, p-value: < 2.2e-16par(mfrow=c(2,2), oma = c(1,1,0,0) + 0.1, mar = c(3,3,1,1) + 0.1)
plot(steplinear)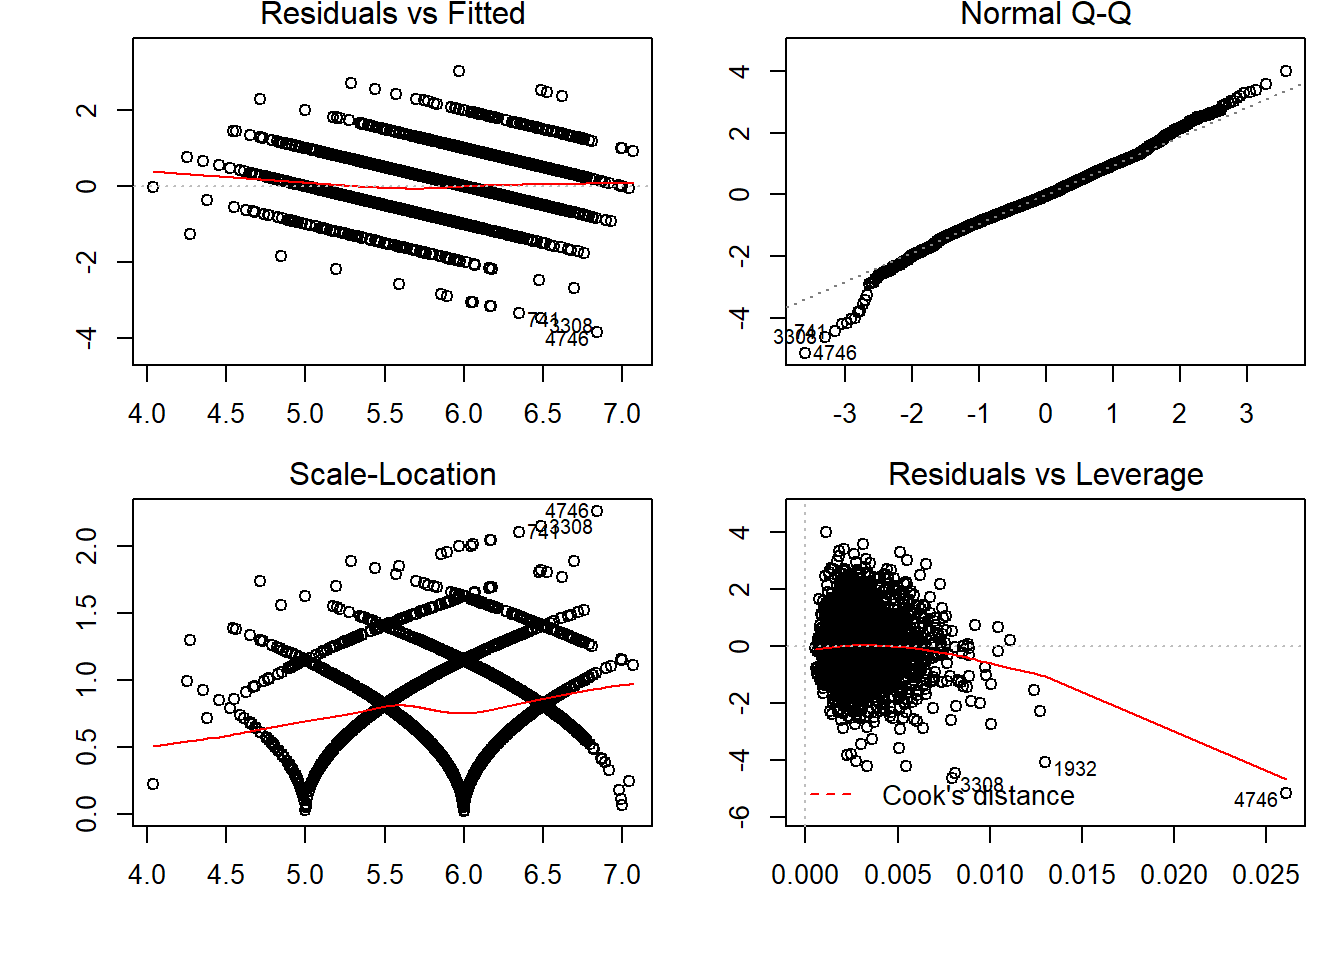
Residuals vs Fitted plot shows if residuals have non-linear patterns.Residuals around a horizontal line without distinct patterns, that is a good indication we don’t have non-linear relationships. Normal QQ plot shows residuals fitting the line. Hence, can call it norlly distibuted residuals.
Scale-Location plot shows if residuals are spread equally along the ranges of predictors. This is how you can check the assumption of equal variance (homoscedasticity). It’s good if you see a horizontal line with equally (randomly) spread points.
Residuals vs Leverage plot has a typical look when there is some influential case. You can barely see Cook’s distance lines (a red dashed line) because all cases are well inside of the Cook’s distance.
Predicting on Trained Set
Predict is a generic function for predictions from the results of various model fitting functions. The function invokes particular methods which depend on the class of the first argument.
distPred <- predict(steplinear, wine_whitetrain)
head(distPred)
## 618 4508 4837 2607 3970 4002
## 5.995269 6.330251 5.065816 6.081245 6.016956 5.010860Converting the Number to a Whole Number. We use the ceiling operation for rounding the numeric values towards near integer values.
distPred1 <- ceiling(distPred)
head(distPred1)
## 618 4508 4837 2607 3970 4002
## 6 7 6 7 7 6Confusion Matrix on Training Data
Frequency tables with condition and cross tabulations.
trn_tab <- table(predicted = distPred1, actual = wine_whitetrain$trans.quality)
trn_tab
## actual
## predicted 3 4 5 6 7 8 9
## 5 2 24 75 22 2 0 0
## 6 4 83 714 697 117 15 1
## 7 7 8 121 595 422 85 3
## 8 0 0 0 0 1 2 0We check the overall accuracy of the linear model.
sum(diag(trn_tab))/length(wine_whitetest$trans.quality)## [1] 0.2746667Accuracy Prediction over train set Linear Model is 27% : BAD NEW!!!
Confusion Matrix on Validating Data
Testing or Validating the Model.
distPred <- predict(steplinear, wine_whitetest)
head(distPred)
## 13 16 17 19 29 32
## 6.015378 6.388735 5.029927 5.702867 5.880534 5.809879Round the numeric values to the nearest integer values.
distPred1 <- ceiling(distPred)
head(distPred1)
## 13 16 17 19 29 32
## 7 7 6 6 6 6tst_tab <- table(predicted = distPred1, actual = wine_whitetest$trans.quality)
tst_tab## actual
## predicted 3 4 5 6 7 8
## 5 0 5 11 4 1 0
## 6 2 16 156 186 12 3
## 7 1 5 26 189 112 19
## 8 0 0 0 2 0 0Checking the accuracy of the test data.
sum(diag(tst_tab))/length(wine_whitetest$trans.quality)## [1] 0.05866667Accuracy Prediction over test set Linear Model is 5.8% : Very very bad news!!!! So we won’t go for this model. Many things to say to accurate the model but it’s not the purpose here. And if we try a quick Ordinal Logistic Regression Model?
Ordinal Logistic Regression Model
No major Assumptions are need for Ordinal logistic regression. The ordinal logistic regression requires the dependent variable to be ordinal.
data_wine_white$quality2 <- as.factor(data_wine_white$quality)Train - Test Set
set.seed(3000)
spl = sample.split(data_wine_white$quality2, SplitRatio = 0.7)

data_wine_whitetrain = subset(data_wine_white, spl==TRUE)
data_wine_whitetest = subset(data_wine_white, spl==FALSE)

head(data_wine_whitetrain)
## fixed.acidity volatile.acidity citric.acid residual.sugar chlorides
## 2 6.3 0.30 0.34 1.60 0.049
## 7 6.2 0.32 0.16 7.00 0.045
## 10 8.1 0.22 0.43 1.50 0.044
## 11 8.1 0.27 0.41 1.45 0.033
## 12 8.6 0.23 0.40 4.20 0.035
## 13 7.9 0.18 0.37 1.20 0.040
## free.sulfur.dioxide total.sulfur.dioxide density pH sulphates alcohol
## 2 14 132 0.9940 3.30 0.49 9.5
## 7 30 136 0.9949 3.18 0.47 9.6
## 10 28 129 0.9938 3.22 0.45 11.0
## 11 11 63 0.9908 2.99 0.56 12.0
## 12 17 109 0.9947 3.14 0.53 9.7
## 13 16 75 0.9920 3.18 0.63 10.8
## quality quality2
## 2 6 6
## 7 6 6
## 10 6 6
## 11 5 5
## 12 5 5
## 13 5 5Fitting ordinal logistic regression Model
require(MASS)
require(reshape2)
## Loading required package: reshape2##
## Attaching package: 'reshape2'## The following object is masked from 'package:tidyr':
##
## smiths## The following objects are masked from 'package:data.table':
##
## dcast, melto_lrm <- polr(quality2 ~ . - quality, data = data_wine_whitetrain, Hess=TRUE)o_lrm <- polr(quality2 ~ . - quality, data = data_wine_whitetrain, Hess=TRUE)should not use vif to check for multicollinarilty in case of categorical veriable.
car::vif(o_lrm)## Warning in vif.default(o_lrm): No intercept: vifs may not be sensible.## fixed.acidity volatile.acidity citric.acid
## 9.437704e+08 3.828385e+08 6.424758e+05
## residual.sugar chlorides free.sulfur.dioxide
## 1.845434e+12 1.457669e+00 6.425308e+00
## total.sulfur.dioxide density pH
## 2.228460e+16 4.943074e+10 1.096931e+10
## sulphates alcohol
## 1.373230e+08 2.243821e+16summary(o_lrm)## Call:
## polr(formula = quality2 ~ . - quality, data = data_wine_whitetrain,
## Hess = TRUE)
##
## Coefficients:
## Value Std. Error t value
## fixed.acidity 0.19109 0.049513 3.859
## volatile.acidity -4.16006 0.396986 -10.479
## citric.acid 0.47473 0.315331 1.506
## residual.sugar 0.18950 0.009254 20.477
## chlorides -1.02123 1.618406 -0.631
## free.sulfur.dioxide 0.01804 0.002996 6.022
## total.sulfur.dioxide -0.00179 0.001256 -1.425
## density -405.55303 0.611027 -663.724
## pH 2.37597 0.279420 8.503
## sulphates 1.83492 0.325575 5.636
## alcohol 0.51080 0.042104 12.132
##
## Intercepts:
## Value Std. Error t value
## 3|4 -393.5020 0.6212 -633.4946
## 4|5 -391.1957 0.6196 -631.3735
## 5|6 -388.2891 0.6262 -620.0709
## 6|7 -385.6073 0.6410 -601.5335
## 7|8 -383.3112 0.6550 -585.2349
## 8|9 -380.0386 0.8192 -463.9258
##
## Residual Deviance: 6145.137
## AIC: 6179.137Smaller the AIC better is the model. So let’s try step wise logistic regression.
o_lr = step(o_lrm)## Start: AIC=6179.14
## quality2 ~ (fixed.acidity + volatile.acidity + citric.acid +
## residual.sugar + chlorides + free.sulfur.dioxide + total.sulfur.dioxide +
## density + pH + sulphates + alcohol + quality) - quality
##
## Df AIC
## - chlorides 1 6177.5
## - total.sulfur.dioxide 1 6179.0
## <none> 6179.1
## - citric.acid 1 6179.4
## - fixed.acidity 1 6183.7
## - alcohol 1 6203.4
## - sulphates 1 6206.0
## - density 1 6207.4
## - free.sulfur.dioxide 1 6213.1
## - pH 1 6217.6
## - residual.sugar 1 6222.9
## - volatile.acidity 1 6287.0
##
## Step: AIC=6177.52
## quality2 ~ fixed.acidity + volatile.acidity + citric.acid + residual.sugar +
## free.sulfur.dioxide + total.sulfur.dioxide + density + pH +
## sulphates + alcohol
##
## Df AIC
## - total.sulfur.dioxide 1 6177.4
## <none> 6177.5
## - citric.acid 1 6177.6
## - fixed.acidity 1 6183.0
## - alcohol 1 6201.6
## - sulphates 1 6204.9
## - density 1 6208.0
## - free.sulfur.dioxide 1 6211.1
## - pH 1 6218.7
## - residual.sugar 1 6225.4
## - volatile.acidity 1 6288.9
##
## Step: AIC=6177.36
## quality2 ~ fixed.acidity + volatile.acidity + citric.acid + residual.sugar +
## free.sulfur.dioxide + density + pH + sulphates + alcohol
##
## Df AIC
## - citric.acid 1 6177.3
## <none> 6177.4
## - fixed.acidity 1 6184.0
## - alcohol 1 6200.2
## - sulphates 1 6204.0
## - density 1 6213.2
## - free.sulfur.dioxide 1 6216.0
## - pH 1 6219.7
## - residual.sugar 1 6229.7
## - volatile.acidity 1 6307.1
##
## Step: AIC=6177.31
## quality2 ~ fixed.acidity + volatile.acidity + residual.sugar +
## free.sulfur.dioxide + density + pH + sulphates + alcohol
##
## Df AIC
## <none> 6177.3
## - fixed.acidity 1 6184.9
## - alcohol 1 6201.8
## - density 1 6211.8
## - sulphates 1 6212.1
## - pH 1 6218.1
## - free.sulfur.dioxide 1 6225.9
## - residual.sugar 1 6228.4
## - volatile.acidity 1 6316.1We see some of the variables got eliminated.
fixed.acidity, alcohol, density, sulphates, pH, free.sulfur.dioxide, residual.sugar, volatile.acidity are the variables being considered.
head(fitted(o_lr))## 3 4 5 6 7 8
## 2 0.012733201 0.102476569 0.5891421 0.2675954 0.02514971 0.002792462
## 7 0.007370319 0.062364804 0.5085991 0.3739248 0.04270917 0.004839804
## 10 0.002796939 0.024740172 0.3137434 0.5415504 0.10395809 0.012702967
## 11 0.001083919 0.009752403 0.1561342 0.5775992 0.22198247 0.032135733
## 12 0.005402251 0.046583924 0.4488420 0.4350332 0.05727276 0.006603401
## 13 0.001270388 0.011408834 0.1775801 0.5833461 0.19772064 0.027554412
## 9
## 2 0.0001105250
## 7 0.0001919682
## 10 0.0005080325
## 11 0.0013121200
## 12 0.0002624039
## 13 0.0011195326Accuracy on Training Set
p <- predict(o_lr, type = "class")
head(p)
## [1] 5 5 6 6 5 6
## Levels: 3 4 5 6 7 8 9#Confusion Matrix Test
cm1 = as.matrix(table(Actual = data_wine_whitetrain$quality2, Predicted = p))
cm1## Predicted
## Actual 3 4 5 6 7 8 9
## 3 0 1 5 7 0 1 0
## 4 0 4 64 38 1 0 0
## 5 0 0 425 393 4 0 0
## 6 1 0 239 936 76 0 0
## 7 0 0 19 355 107 1 0
## 8 0 0 2 59 31 0 0
## 9 0 0 0 1 3 0 0sum(diag(cm1))/length(data_wine_whitetrain$quality2)## [1] 0.530833Training Set Accuracy is 53.08% :BAD NEWS AGAIN!!!!
Accuracy on Test Set
Accuray for the test set.
tst_pred <- predict(o_lr, newdata = data_wine_whitetest, type = "class")#Confusion Matrix Test
cm2 <- table(predicted = tst_pred, actual = data_wine_whitetest$quality2)
cm2## actual
## predicted 3 4 5 6 7 8 9
## 3 0 0 0 0 0 0 0
## 4 0 0 0 0 0 0 0
## 5 2 32 177 93 6 1 0
## 6 3 14 171 410 156 26 0
## 7 1 0 5 33 45 12 1
## 8 0 0 0 0 0 0 0
## 9 0 0 0 0 0 0 0sum(diag(cm2))/length(data_wine_whitetrain$quality2)## [1] 0.227912Test Set Accuracy - 22.7 % BAD NEWS AGAIN!!!! Let’s now do a logistic regression.
Binomial Logistic Regression Model
The variable to be predicted is binary and hence we use binomial logistic regression. Quality lower and equal than 5 is bad and greather than 5 is good.
data_wine_white$category[data_wine_white$quality <= 5] <- 0
data_wine_white$category[data_wine_white$quality > 5] <- 1

data_wine_white$category <- as.factor(data_wine_white$category)
head(data_wine_white)
## fixed.acidity volatile.acidity citric.acid residual.sugar chlorides
## 1 7.0 0.27 0.36 20.7 0.045
## 2 6.3 0.30 0.34 1.6 0.049
## 3 8.1 0.28 0.40 6.9 0.050
## 4 7.2 0.23 0.32 8.5 0.058
## 7 6.2 0.32 0.16 7.0 0.045
## 10 8.1 0.22 0.43 1.5 0.044
## free.sulfur.dioxide total.sulfur.dioxide density pH sulphates alcohol
## 1 45 170 1.0010 3.00 0.45 8.8
## 2 14 132 0.9940 3.30 0.49 9.5
## 3 30 97 0.9951 3.26 0.44 10.1
## 4 47 186 0.9956 3.19 0.40 9.9
## 7 30 136 0.9949 3.18 0.47 9.6
## 10 28 129 0.9938 3.22 0.45 11.0
## quality quality2 category
## 1 6 6 1
## 2 6 6 1
## 3 6 6 1
## 4 6 6 1
## 7 6 6 1
## 10 6 6 1Train Test Split
set.seed(3000)

spl = sample.split(data_wine_white$category, SplitRatio = 0.7)

data_wine_whitetrain = subset(data_wine_white, spl==TRUE)
data_wine_whitetest = subset(data_wine_white, spl==FALSE)
Let’s run a quick and dirty logistic regression.
model_glm <- glm(category ~ . - quality - quality2, data = data_wine_whitetrain, family=binomial(link = "logit"))
model_gl <- step(model_glm)
## Start: AIC=2821.85
## category ~ (fixed.acidity + volatile.acidity + citric.acid +
## residual.sugar + chlorides + free.sulfur.dioxide + total.sulfur.dioxide +
## density + pH + sulphates + alcohol + quality + quality2) -
## quality - quality2
##
## Df Deviance AIC
## - total.sulfur.dioxide 1 2797.9 2819.9
## - chlorides 1 2797.9 2819.9
## - fixed.acidity 1 2798.0 2820.0
## <none> 2797.8 2821.8
## - citric.acid 1 2800.2 2822.2
## - free.sulfur.dioxide 1 2806.9 2828.9
## - pH 1 2809.7 2831.7
## - density 1 2811.5 2833.5
## - sulphates 1 2817.4 2839.4
## - residual.sugar 1 2823.2 2845.2
## - alcohol 1 2826.3 2848.3
## - volatile.acidity 1 2916.6 2938.6
##
## Step: AIC=2819.87
## category ~ fixed.acidity + volatile.acidity + citric.acid + residual.sugar +
## chlorides + free.sulfur.dioxide + density + pH + sulphates +
## alcohol
##
## Df Deviance AIC
## - chlorides 1 2798.0 2818.0
## - fixed.acidity 1 2798.0 2818.0
## <none> 2797.9 2819.9
## - citric.acid 1 2800.2 2820.2
## - pH 1 2809.7 2829.7
## - density 1 2811.8 2831.8
## - free.sulfur.dioxide 1 2813.1 2833.1
## - sulphates 1 2817.8 2837.8
## - residual.sugar 1 2823.4 2843.4
## - alcohol 1 2826.6 2846.6
## - volatile.acidity 1 2920.6 2940.6
##
## Step: AIC=2817.97
## category ~ fixed.acidity + volatile.acidity + citric.acid + residual.sugar +
## free.sulfur.dioxide + density + pH + sulphates + alcohol
##
## Df Deviance AIC
## - fixed.acidity 1 2798.2 2816.2
## <none> 2798.0 2818.0
## - citric.acid 1 2800.3 2818.3
## - pH 1 2810.3 2828.3
## - density 1 2812.6 2830.6
## - free.sulfur.dioxide 1 2813.1 2831.1
## - sulphates 1 2818.1 2836.1
## - residual.sugar 1 2825.1 2843.1
## - alcohol 1 2826.7 2844.7
## - volatile.acidity 1 2922.7 2940.7
##
## Step: AIC=2816.17
## category ~ volatile.acidity + citric.acid + residual.sugar +
## free.sulfur.dioxide + density + pH + sulphates + alcohol
##
## Df Deviance AIC
## <none> 2798.2 2816.2
## - citric.acid 1 2800.6 2816.6
## - free.sulfur.dioxide 1 2813.1 2829.1
## - pH 1 2817.6 2833.6
## - sulphates 1 2818.2 2834.2
## - density 1 2824.1 2840.1
## - residual.sugar 1 2841.8 2857.8
## - alcohol 1 2863.4 2879.4
## - volatile.acidity 1 2927.8 2943.8what the prediction looks like.
head(fitted(model_gl))## 2 7 10 11 13 15
## 0.3085439 0.3942105 0.6825519 0.8508986 0.8124451 0.4915685head(predict(model_gl))## 2 7 10 11 13 15
## -0.80693550 -0.42964756 0.76552441 1.74166660 1.46597646 -0.03372931head(predict(model_gl, type = "response"))## 2 7 10 11 13 15
## 0.3085439 0.3942105 0.6825519 0.8508986 0.8124451 0.4915685Catagorizing Set
trn_pred <- ifelse(predict(model_gl, type = "response") > 0.5,"1", "0")
head(trn_pred)
## 2 7 10 11 13 15
## "0" "0" "1" "1" "1" "0"Confusion Matrix on Training Set
Obtaining confusion matrix of the training data and ROC.
confusionMatrix(data = as.factor(trn_pred), reference = as.factor(data_wine_whitetrain$category),positive = "1")## Confusion Matrix and Statistics
##
## Reference
## Prediction 0 1
## 0 504 254
## 1 440 1575
##
## Accuracy : 0.7497
## 95% CI : (0.7332, 0.7658)
## No Information Rate : 0.6596
## P-Value [Acc > NIR] : < 2.2e-16
##
## Kappa : 0.4148
##
## Mcnemar's Test P-Value : 2.179e-12
##
## Sensitivity : 0.8611
## Specificity : 0.5339
## Pos Pred Value : 0.7816
## Neg Pred Value : 0.6649
## Prevalence : 0.6596
## Detection Rate : 0.5680
## Detection Prevalence : 0.7266
## Balanced Accuracy : 0.6975
##
## 'Positive' Class : 1
## We can see that Binomial Logistic Regression gives an training set accuracy of 74.97% (with confidence interval of [0.7332, 0.7658]): AT LEAST A GOOD NEW!!!!
Accuracy on Test Set
Confusion matrix for the test data.
tst_pred <- ifelse(predict(model_gl, newdata = data_wine_whitetest, type = "response") > 0.5, "1", "0")
tst_tab <- table(predicted = tst_pred, actual = data_wine_whitetest$category)
tst_tab
## actual
## predicted 0 1
## 0 212 110
## 1 192 674sum(diag(tst_tab))/length(data_wine_whitetest$category)## [1] 0.7457912 confusionMatrix(data = as.factor(tst_pred), reference=as.factor(data_wine_whitetest$category))## Confusion Matrix and Statistics
##
## Reference
## Prediction 0 1
## 0 212 110
## 1 192 674
##
## Accuracy : 0.7458
## 95% CI : (0.72, 0.7703)
## No Information Rate : 0.6599
## P-Value [Acc > NIR] : 9.769e-11
##
## Kappa : 0.4043
##
## Mcnemar's Test P-Value : 3.146e-06
##
## Sensitivity : 0.5248
## Specificity : 0.8597
## Pos Pred Value : 0.6584
## Neg Pred Value : 0.7783
## Prevalence : 0.3401
## Detection Rate : 0.1785
## Detection Prevalence : 0.2710
## Balanced Accuracy : 0.6922
##
## 'Positive' Class : 0
## We can see that Binomial Logistic Regression gives an test set accuracy of 74.58%.
The two accuracy seems constant so no evidence of overfitting.
One important thing to keep in mind even when the accuracy is good depending on the business are Sensitivity and Specificity.
Finaly good accuracy to go but how can we explain this results to the business?
For business insights it’s important to understand which factors drive predictions and especially for each observations.
So let’s explain this prediction for a single observation.
drop <- c("quality","quality2")
data_wine_whitetrain2 = data_wine_whitetrain[,!(names(data_wine_whitetrain) %in% drop)]
data_wine_whitetest2 = data_wine_whitetest[,!(names(data_wine_whitetest) %in% drop)]
new_observation <- data_wine_whitetest2[2,]
new_observation## fixed.acidity volatile.acidity citric.acid residual.sugar chlorides
## 3 8.1 0.28 0.4 6.9 0.05
## free.sulfur.dioxide total.sulfur.dioxide density pH sulphates alcohol
## 3 30 97 0.9951 3.26 0.44 10.1
## category
## 3 1print('following this observation, this category is a good wine')## [1] "following this observation, this category is a good wine"Let’s create a custom predict function which returns probalilities.
p_fun <- function(object, newdata) {
   if (nrow(newdata) == 1) {
      as.matrix(t(predict(object, newdata, type = "prob")))
   } else {
     as.matrix(predict(object, newdata=newdata, type = "prob"))
   }
}
Now we create an object of the break_down class.
library("iBreakDown")## Warning: package 'iBreakDown' was built under R version 3.6.2library("nnet")
m_glm <- multinom(category ~ . , data = data_wine_whitetest2, probabilities = TRUE, model = TRUE)## # weights: 13 (12 variable)
## initial value 823.458851
## iter 10 value 598.392466
## iter 20 value 589.563401
## iter 30 value 589.549279
## iter 40 value 589.542788
## iter 50 value 589.076016
## iter 60 value 588.727363
## final value 588.725343
## convergedbd_glm <- local_attributions(m_glm,
data = data_wine_whitetest2,
new_observation = new_observation,
keep_distributions = TRUE,
predict_function = p_fun)
bd_glm## contribution
## multinom: intercept 0.660
## multinom: alcohol = 10 -0.041
## multinom: total.sulfur.dioxide = 97 0.042
## multinom: density = 1 -0.053
## multinom: free.sulfur.dioxide = 30 -0.013
## multinom: pH = 3.3 0.019
## multinom: sulphates = 0.44 -0.018
## multinom: fixed.acidity = 8.1 0.010
## multinom: citric.acid = 0.4 0.006
## multinom: volatile.acidity = 0.28 0.007
## multinom: chlorides = 0.05 0.001
## multinom: residual.sugar = 6.9 0.034
## multinom: category = 1 0.000
## multinom: prediction 0.654And we can see how each variable contribute to the prediction to be good or bad wine for this observation.
plot(bd_glm)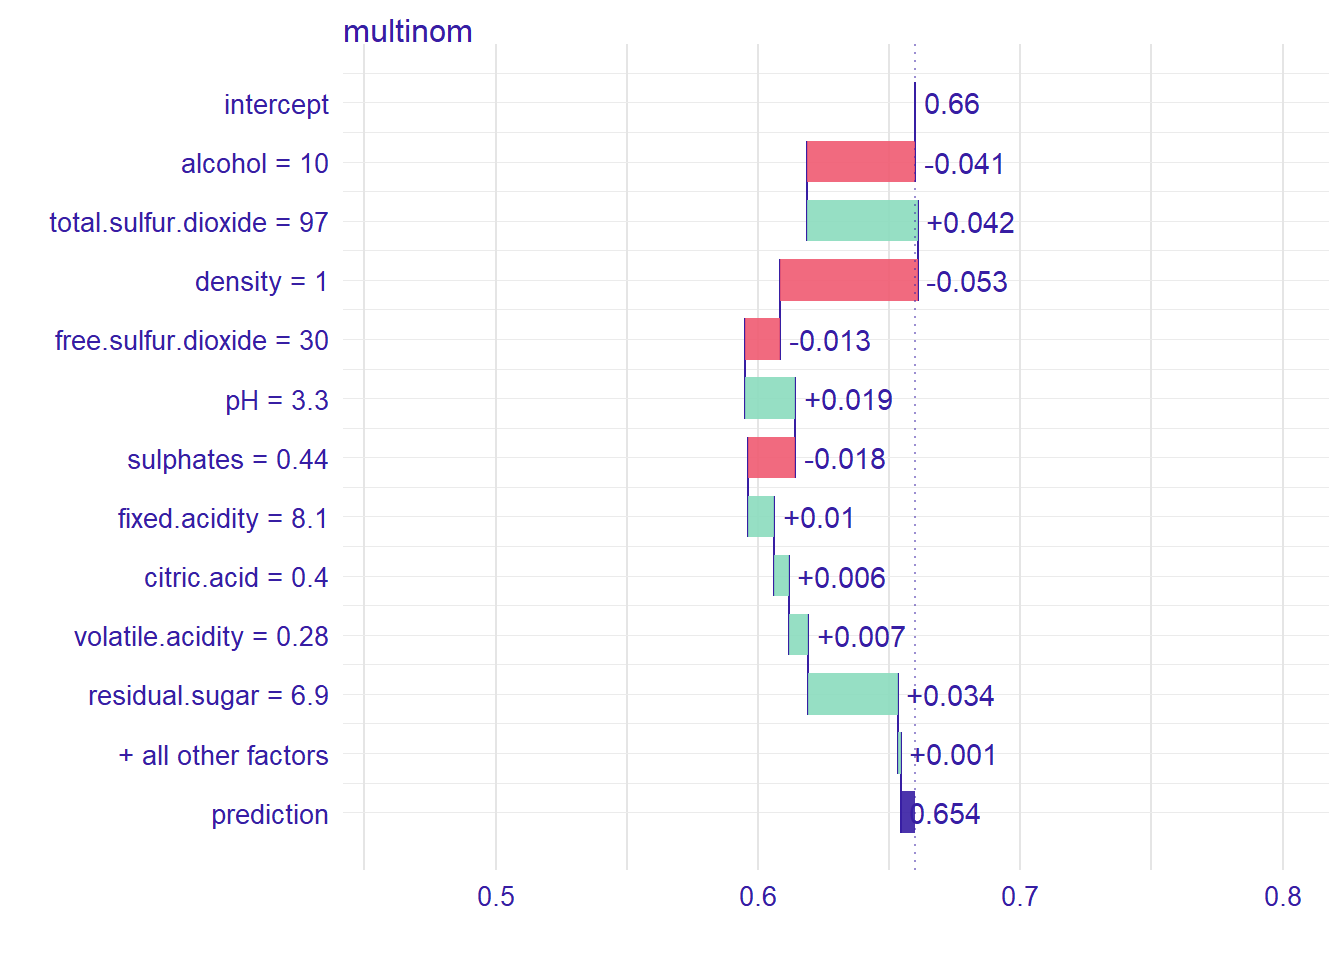
plot(plot(bd_glm, baseline = 0))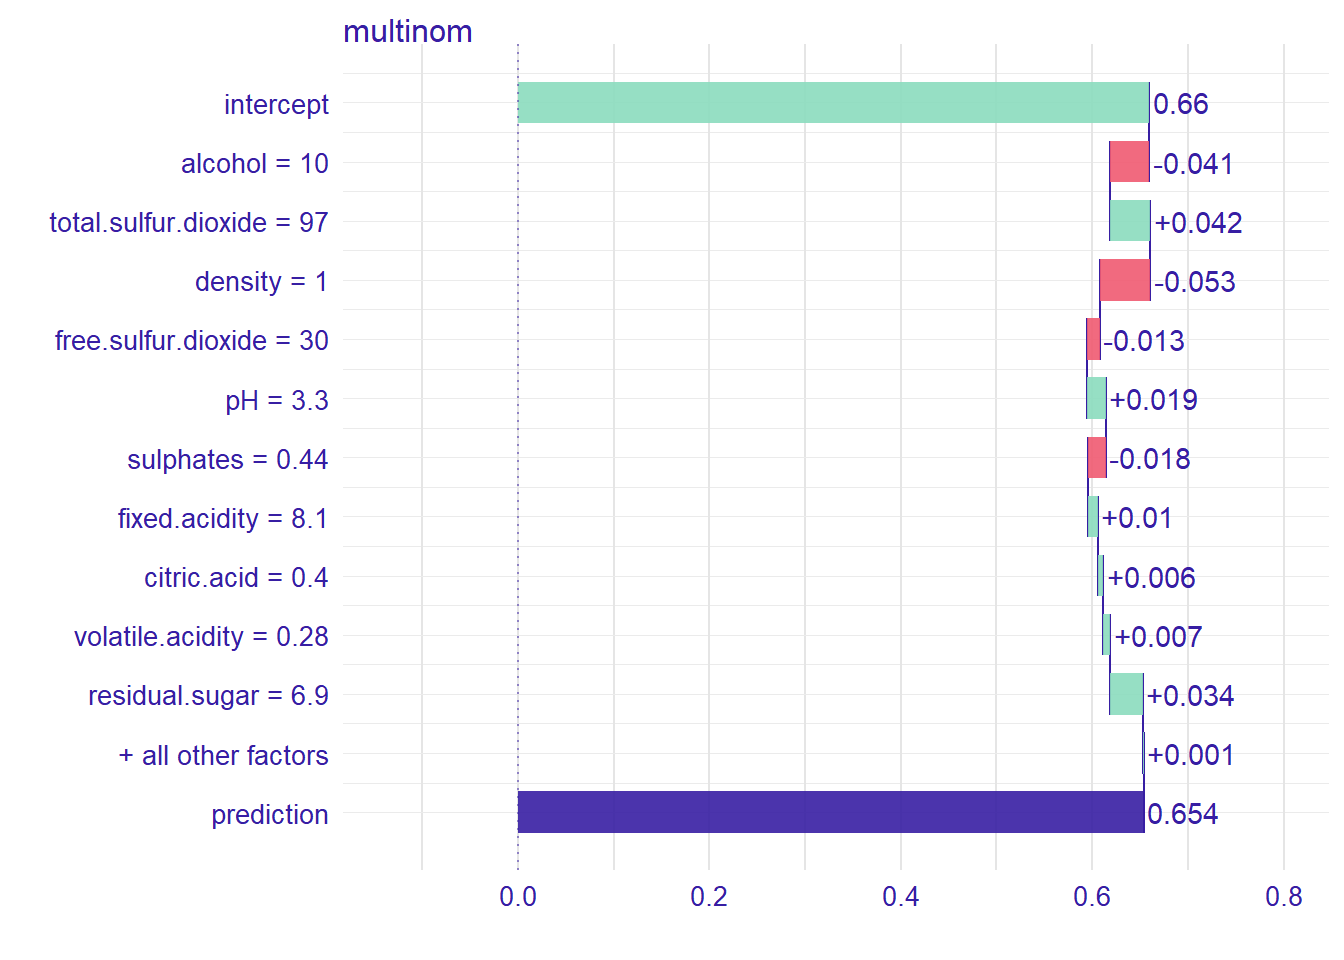
And the distributions of partial predictions for this observation.
plot(bd_glm, plot_distributions = TRUE)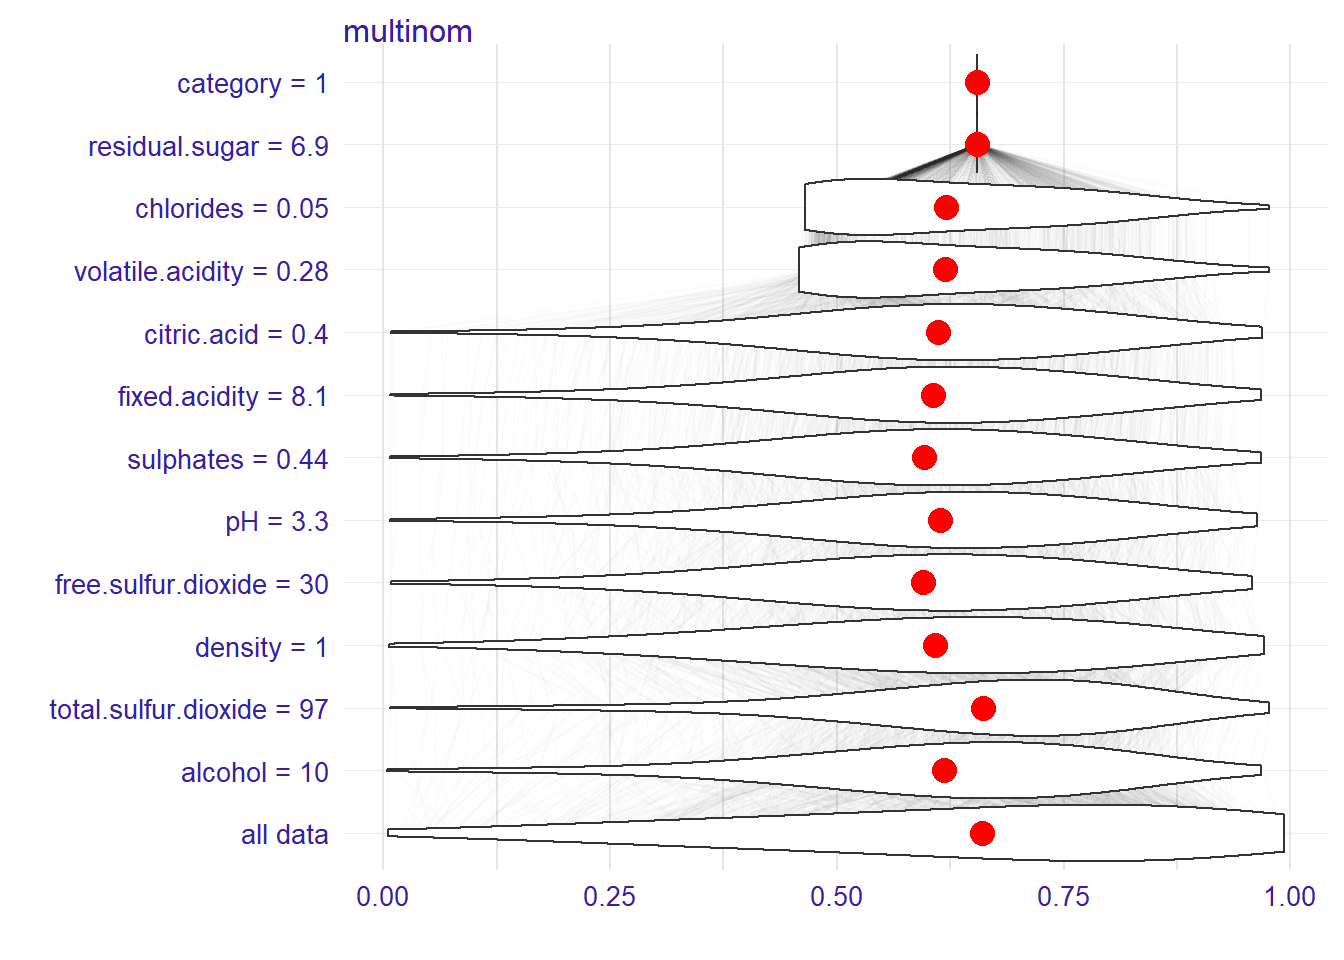
We could have a Dashboard or shiny application that can shows by selecting each observation which variables explain why the wine is for good or bad quality: it’s calls Make a studio for the model (https://github.com/ModelOriented/modelStudio/blob/master/misc/MLinPL2019_modelStudio_poster.pdf).
We can see that Binomial Logistic Regression gives a good accuracy to predict the quality of the wine.
We get to know that chlorides, sulphates, pH, alcohol, volatile acidity and free sulphur dioxide are more statiscally significant in predicting the quality of Vinho Verde white wine.
Something else that is good to know is the variation of the prediction following the variable evolution.
To assess this let’s perform a quick and dirty random forest.
Random Forest
It’s important to see the general variation of the prediction of the variables of the in the model. Let’s switch to another model: random Forest and a full datasets to perform with the same variables of the logistic previous model.
train  <- data_wine_whitetrain2
valid  <- data_wine_whitetest2

full_dataset<-rbind(train,valid)
library("DALEX")
library("randomForest")
set.seed(59)
# Random Forest model trained on apartments data
model_rf <- randomForest(category ~ . ,
data = full_dataset)The Confusion Matrix of this model:
# Add predicted values to data frame
df_rf<-full_dataset <- full_dataset %>%
  mutate(predicted = predict(model_rf))

# Get performance measures
confusionMatrix(df_rf$predicted, df_rf$category, positive = "1")
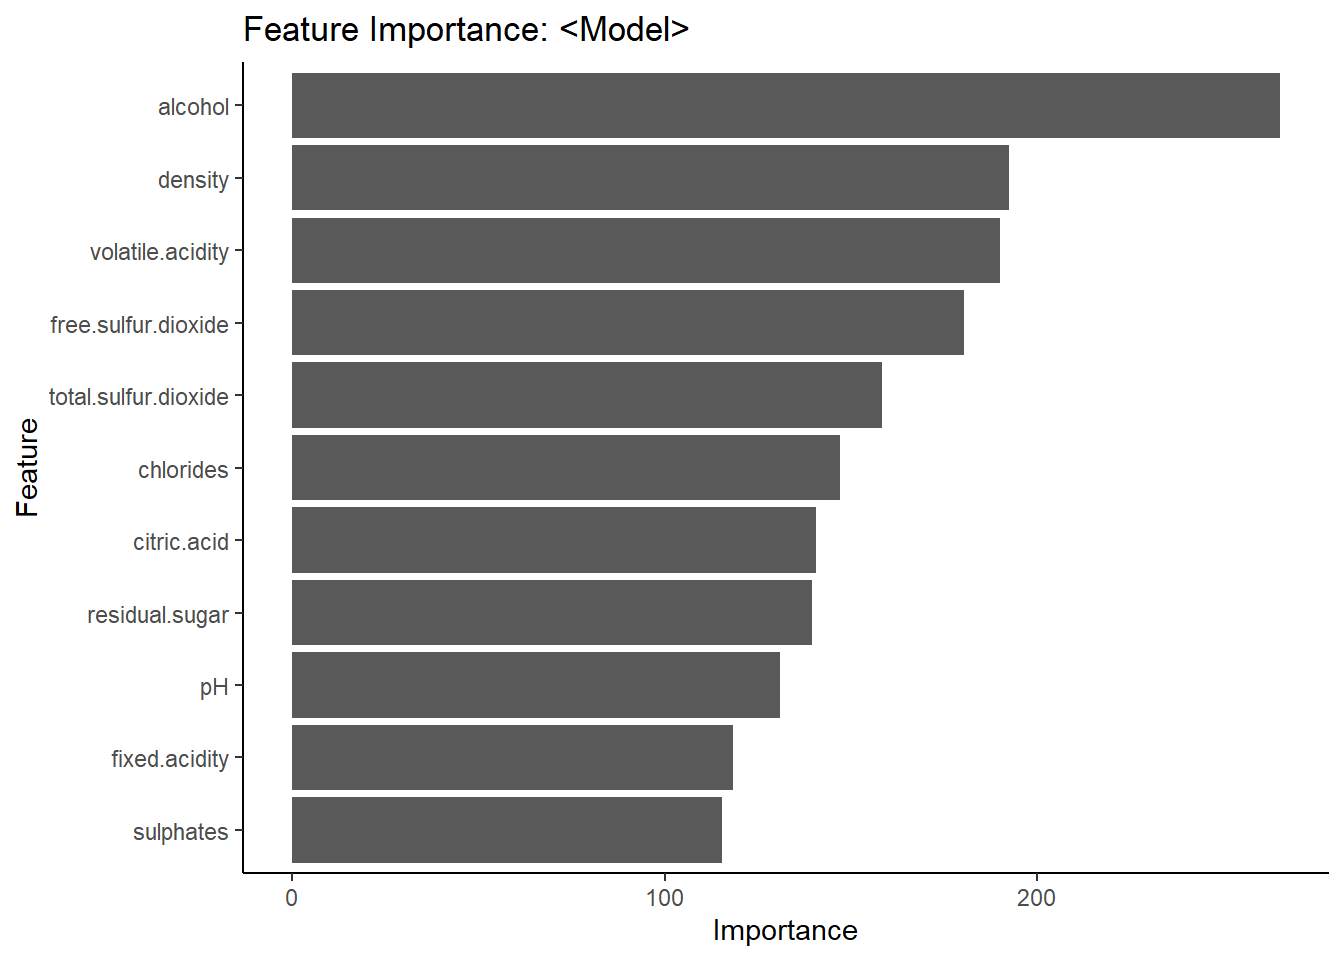
Accuracy of 78.06% not so far from the Logistic regression. Now let’s get a look to the important variables in the model. We can see that alohol is the most important variable in the model, followed by density and volatile.acidity.
feat_imp_df <- importance(model_rf) %>%
  data.frame() %>%
  mutate(feature = row.names(.))

# plot dataframe
ggplot(feat_imp_df, aes(x = reorder(feature, MeanDecreaseGini),
                        y = MeanDecreaseGini)) +
  geom_bar(stat='identity') +
  coord_flip() +
  theme_classic() +
  labs(
    x     = "Feature",
    y     = "Importance",
    title = "Feature Importance: <Model>"
  )
One of the main insigth for business is to get throw each variable, their prediction and variation.
explainer_rf <- explain(model_rf,
                       data = full_dataset, y = data_wine_whitetrain2$category)
## Preparation of a new explainer is initiated
## -> model label : randomForest ( [33m default [39m )
## -> data : 3961 rows 13 cols
## -> target variable : 2773 values
## -> target variable : length of 'y' is different than number of rows in 'data' ( [31m WARNING [39m )
## -> target variable : Please note that 'y' is a factor. ( [31m WARNING [39m )
## -> target variable : Consider changing the 'y' to a logical or numerical vector.
## -> target variable : Otherwise I will not be able to calculate residuals or loss function.
## -> predict function : yhat.randomForest will be used ( [33m default [39m )
## -> predicted values : numerical, min = 0.01 , mean = 0.6584918 , max = 1
## -> residual function : difference between y and yhat ( [33m default [39m )
## -> residuals : numerical, min = NA , mean = NA , max = NA
## -> model_info : package randomForest , ver. 4.6.14 , task classification ( [33m default [39m )
## [32m A new explainer has been created! [39mlibrary("pdp")
expl_alcohol <- feature_response(explainer_rf, "alcohol", "pdp")
plot(expl_alcohol)
So when the alcohol get high, the prediction to get of good quality increase. Let’s do it for all the variables.
expl_density <- feature_response(explainer_rf, "density", "pdp")
plot(expl_density )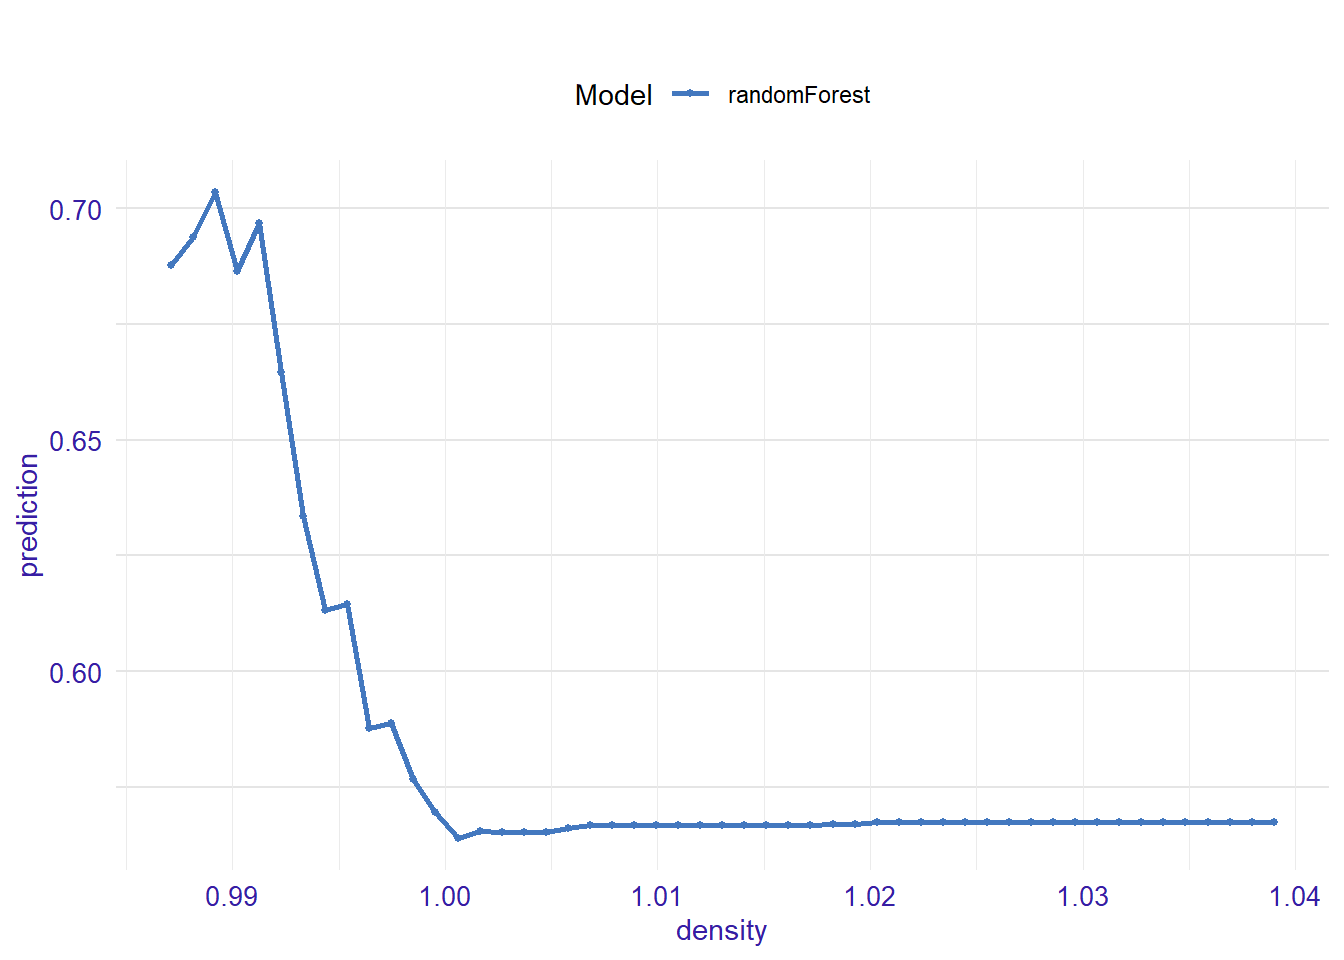
expl_volatile.acidity <- feature_response(explainer_rf, "volatile.acidity", "pdp")
plot(expl_volatile.acidity )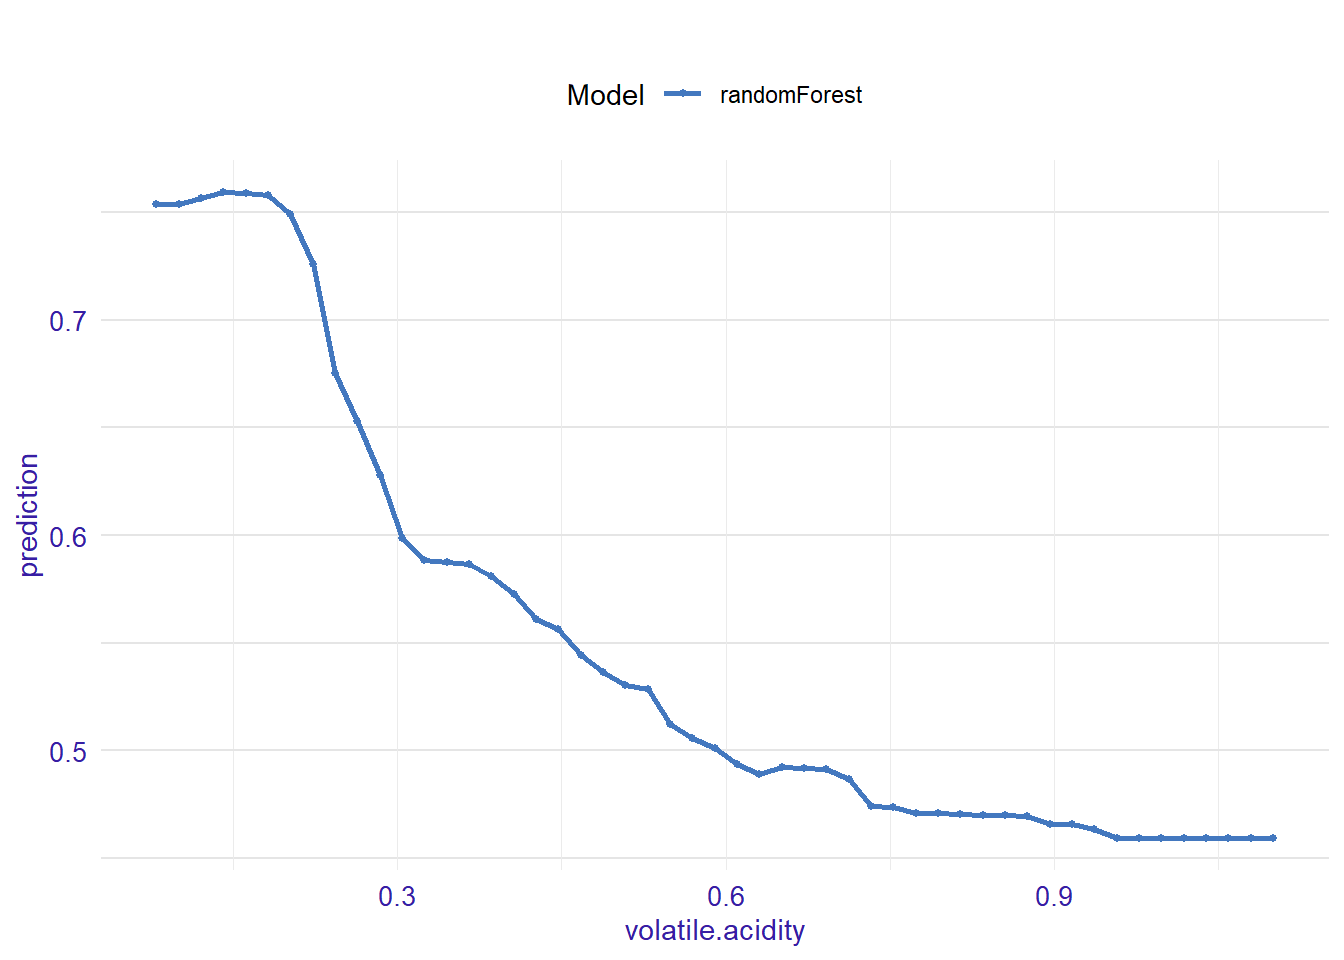
expl_free.sulfur.dioxide <- feature_response(explainer_rf, "free.sulfur.dioxide", "pdp")
plot(expl_free.sulfur.dioxide)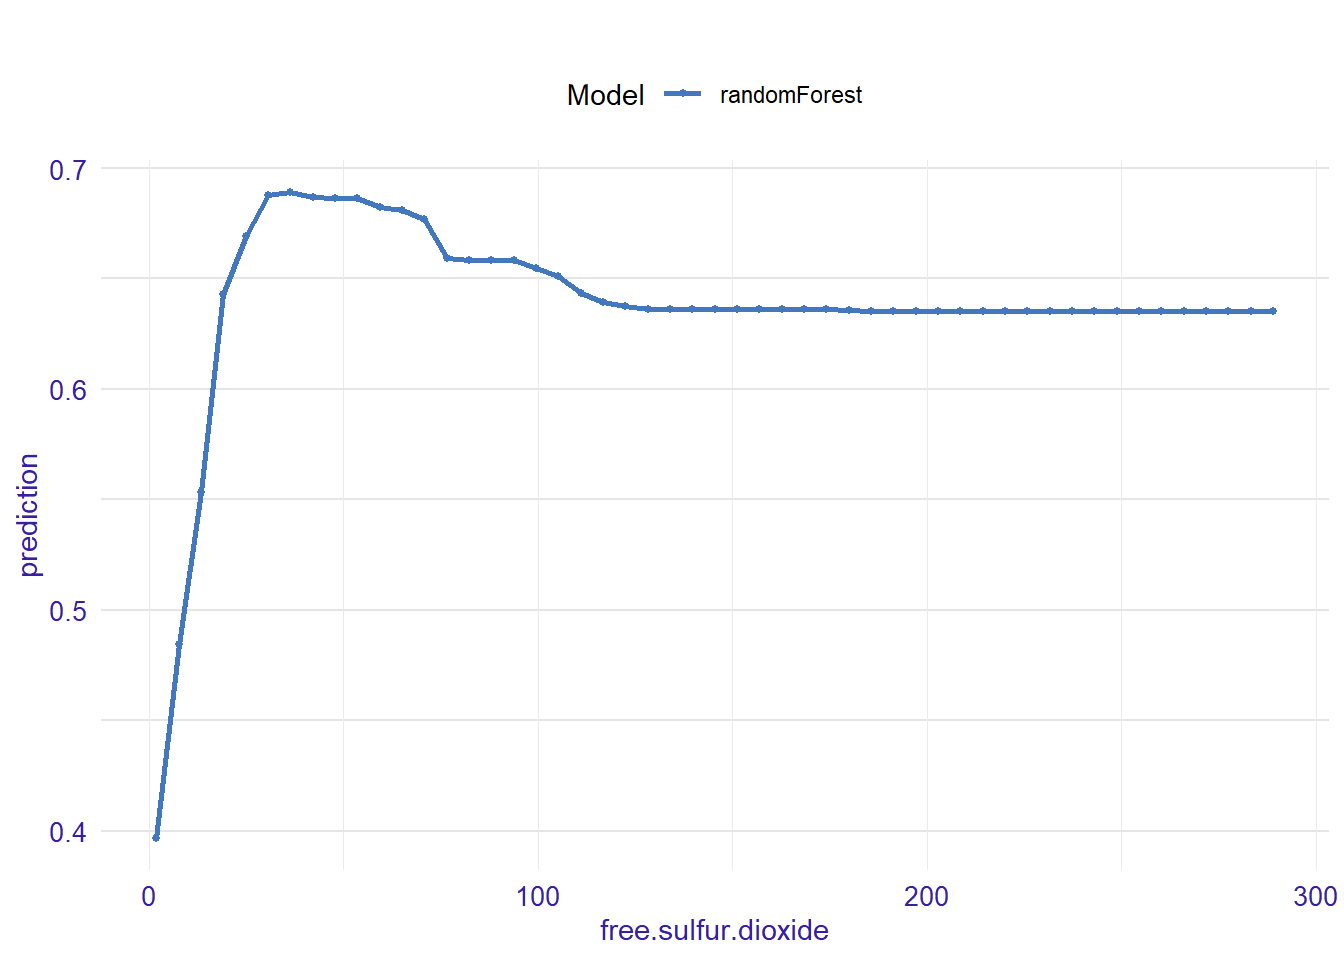
expl_total.sulfur.dioxide <- feature_response(explainer_rf, "total.sulfur.dioxide", "pdp")
plot(expl_total.sulfur.dioxide)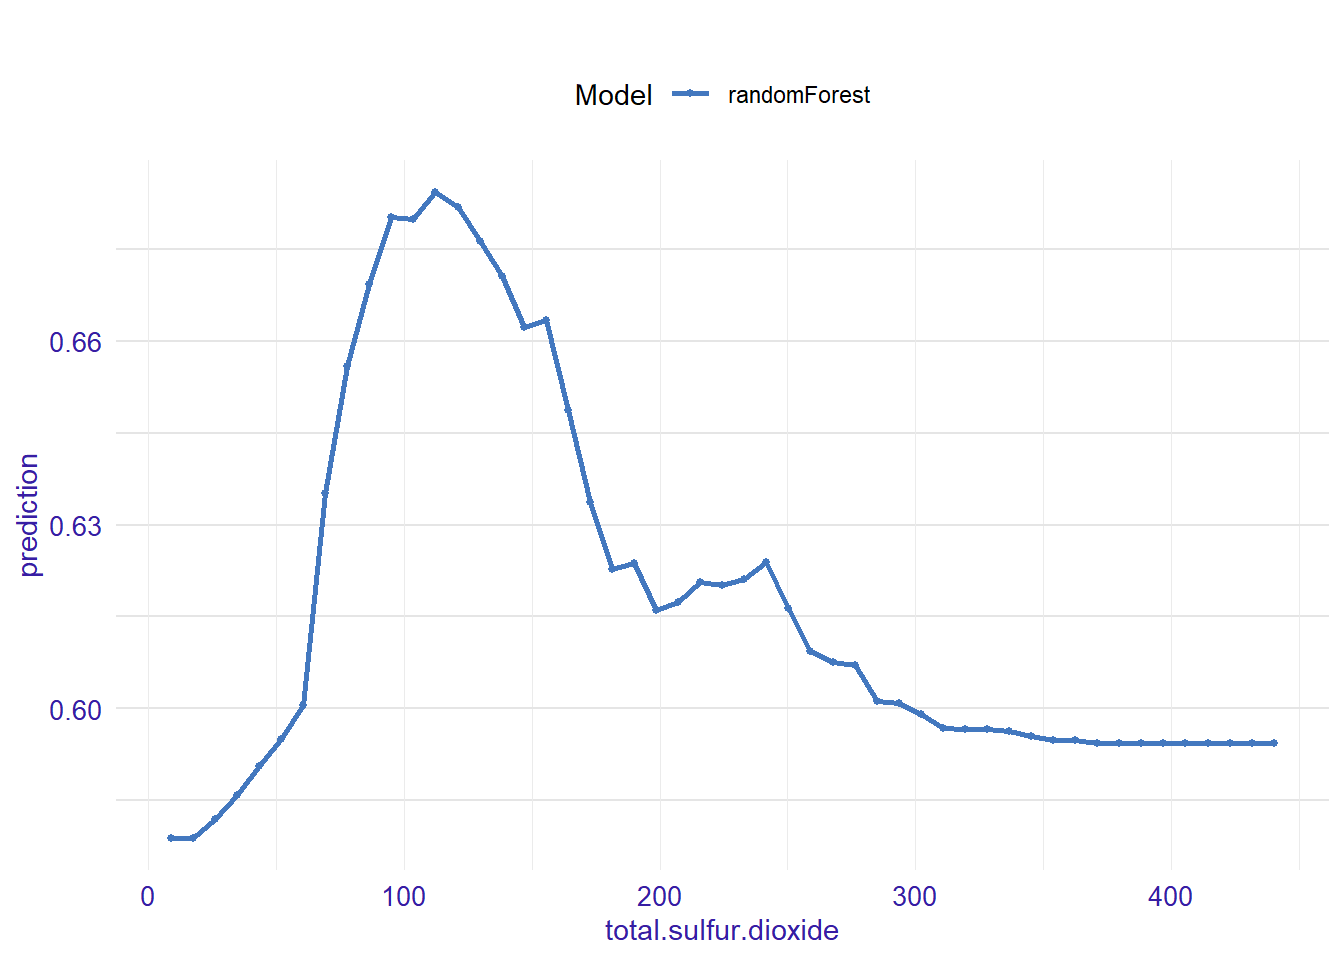
expl_chlorides <- feature_response(explainer_rf, "chlorides", "pdp")
plot(expl_chlorides)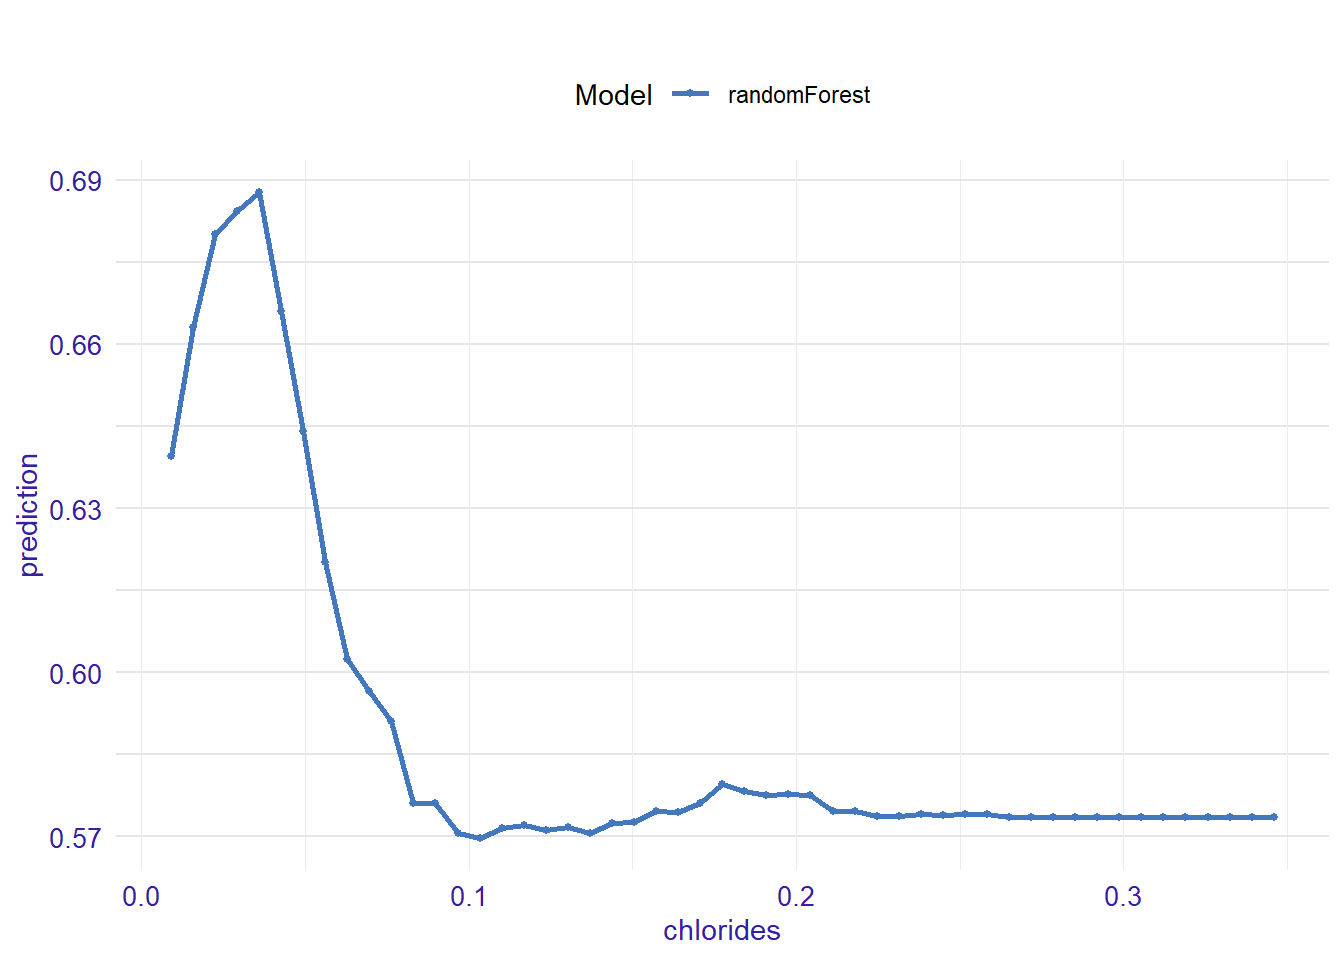
expl_citric.acid <- feature_response(explainer_rf, "citric.acid", "pdp")
plot(expl_citric.acid)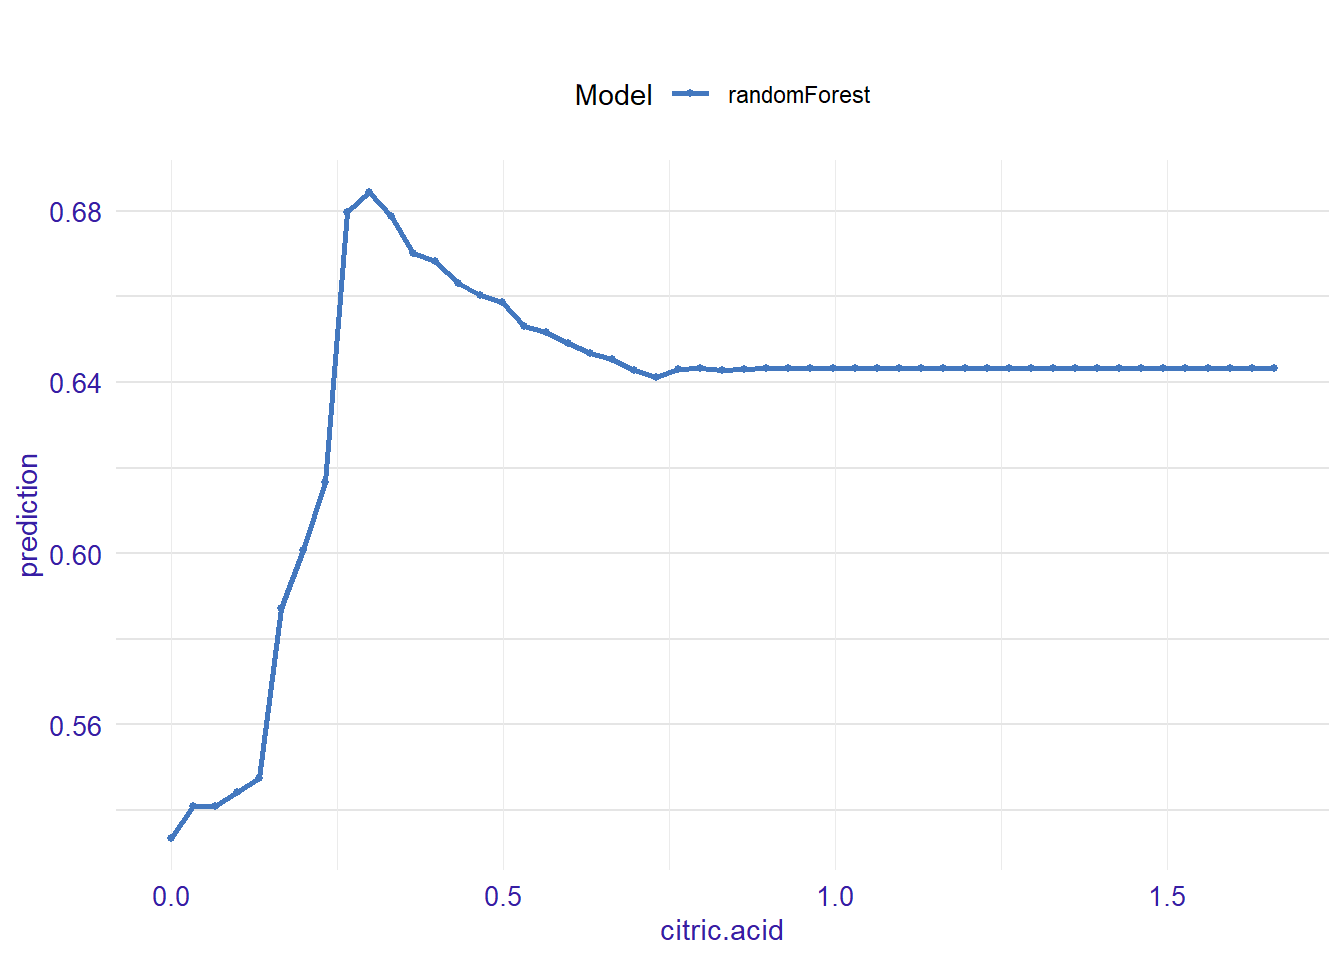
expl_residual.sugar <- feature_response(explainer_rf, "residual.sugar", "pdp")
plot(expl_residual.sugar)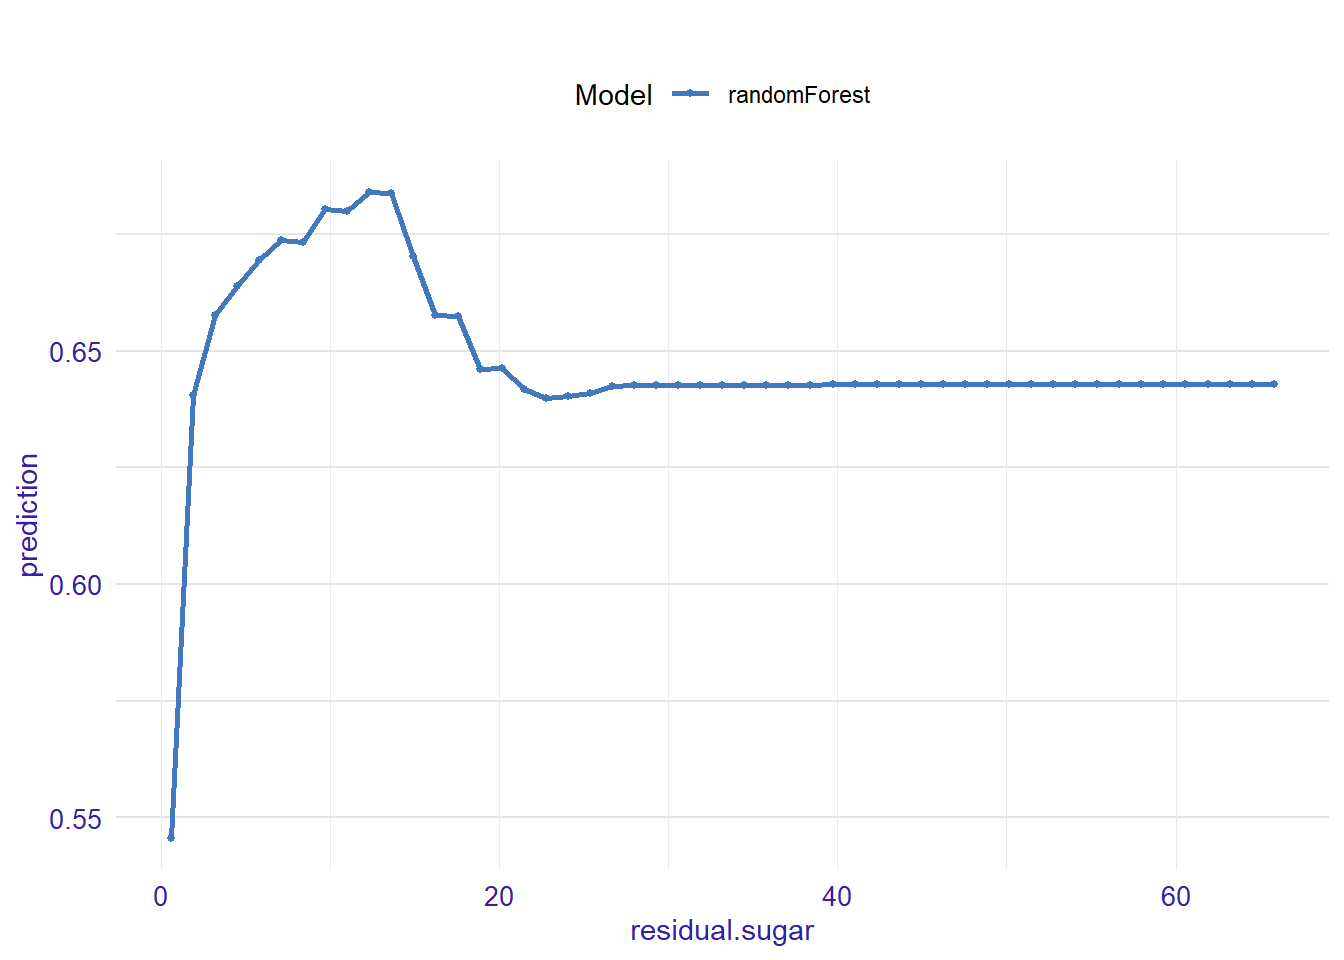
expl_pH <- feature_response(explainer_rf, "pH", "pdp")
plot(expl_pH)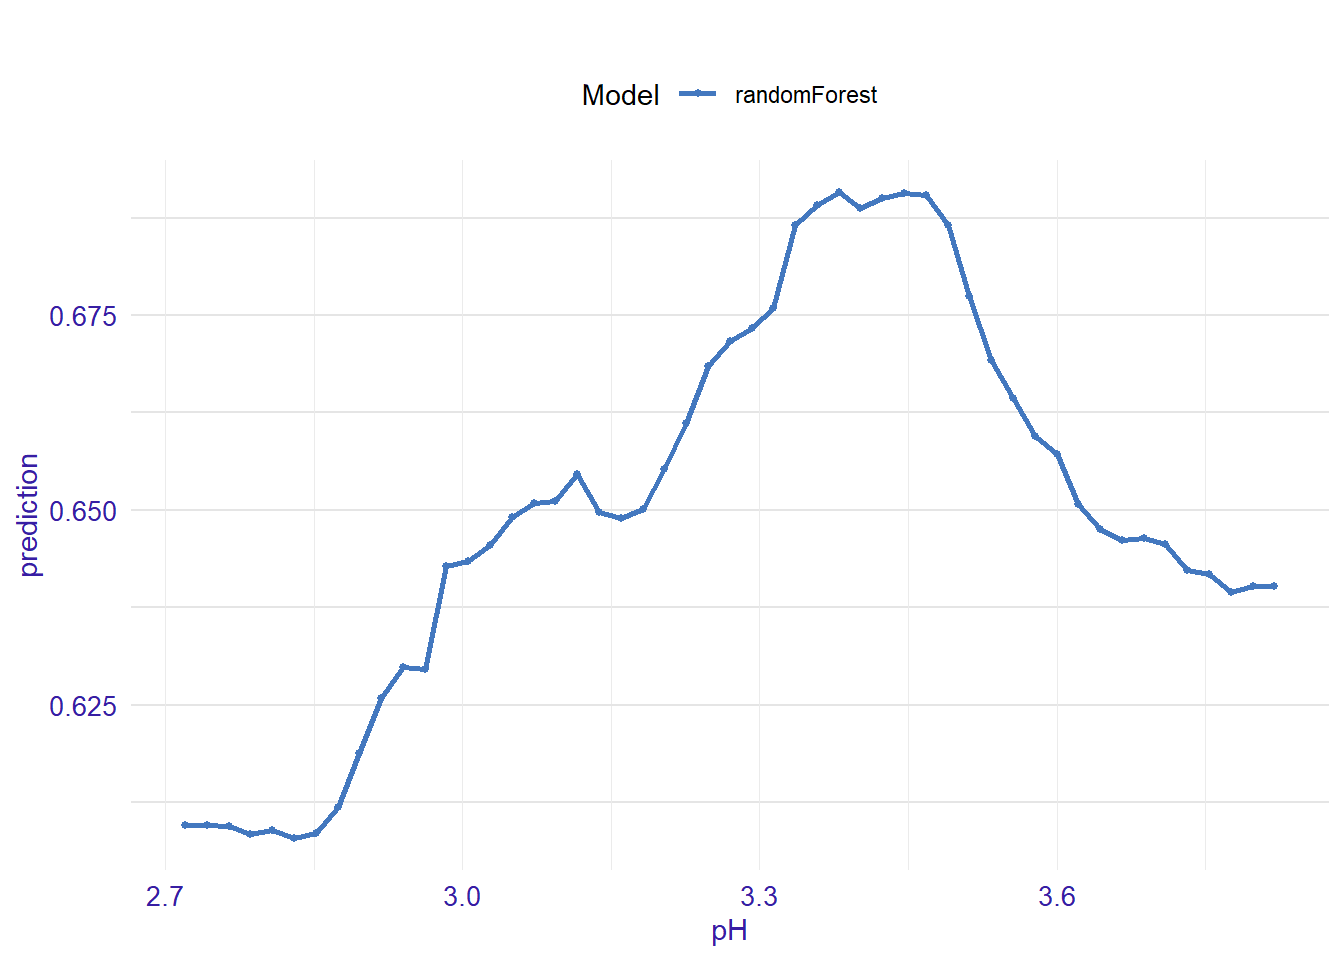
expl_sulphates <- feature_response(explainer_rf, "sulphates", "pdp")
plot(expl_sulphates)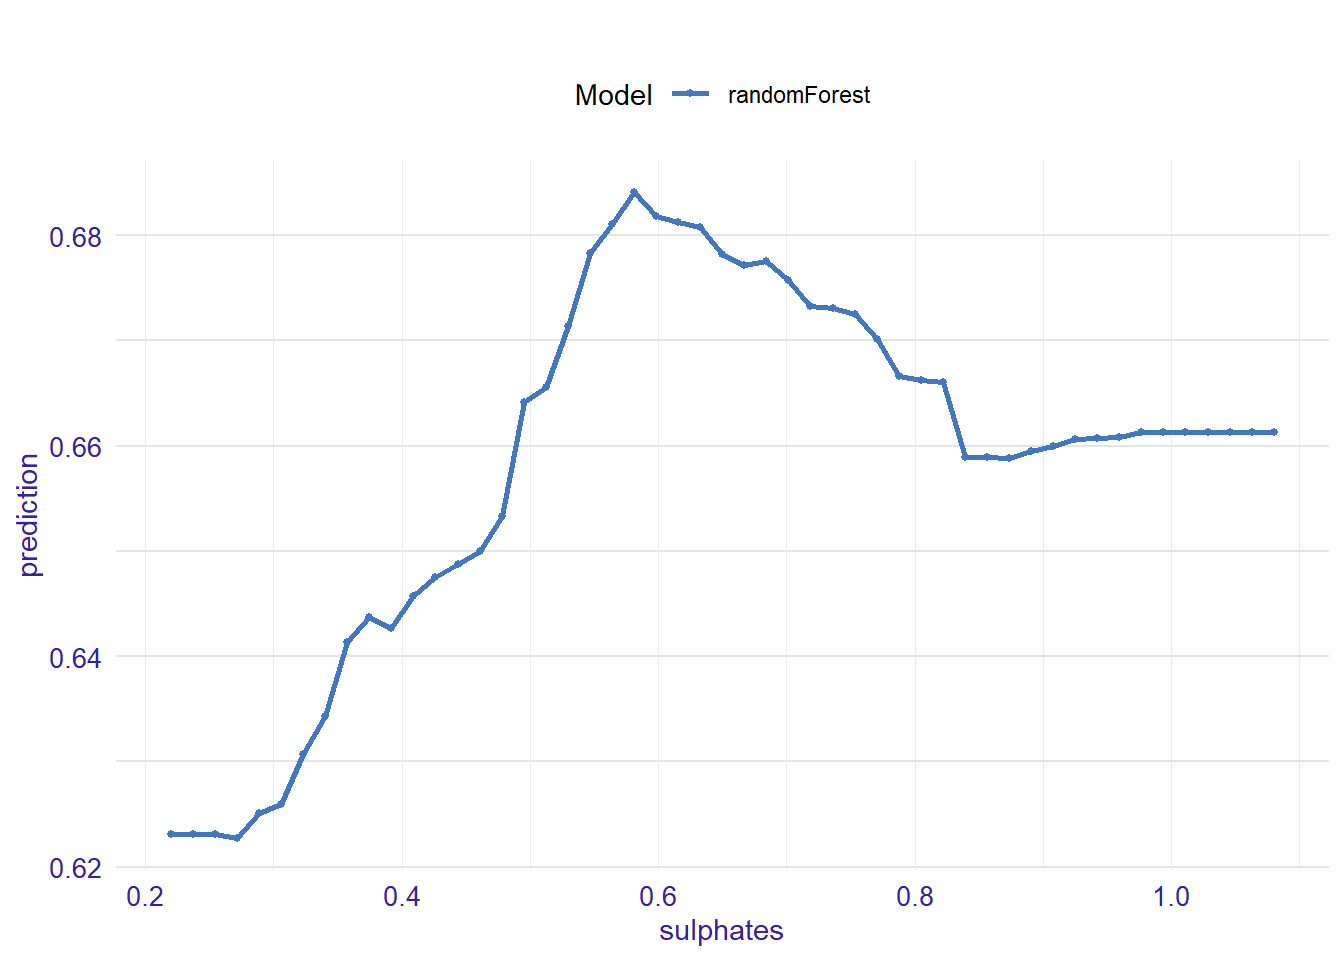
expl_fixed.acidity <- feature_response(explainer_rf, "fixed.acidity", "pdp")
plot(expl_fixed.acidity)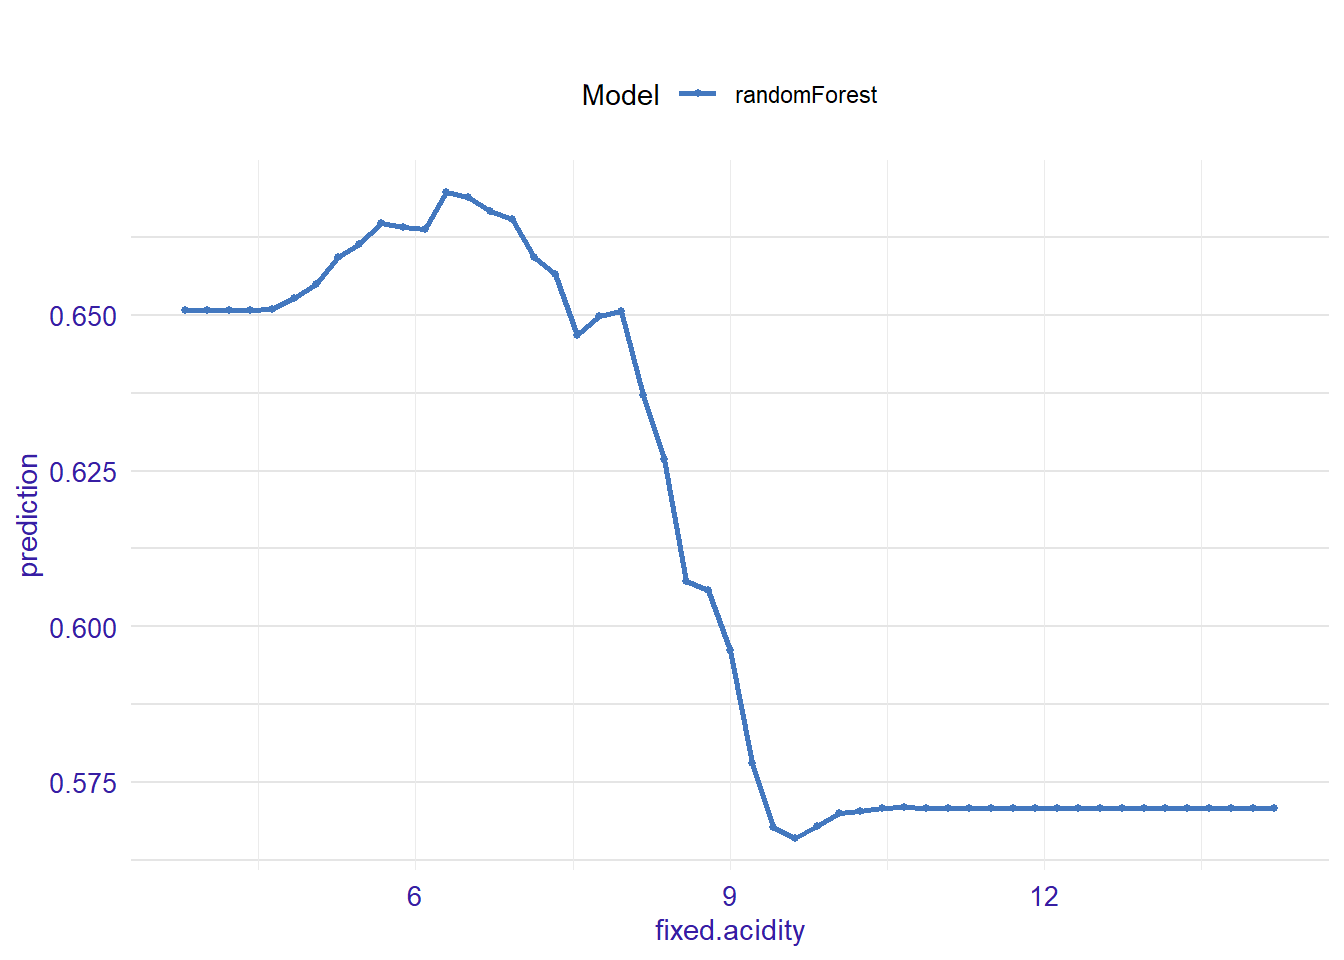
All those results are nice to have for insights and we could do much more.